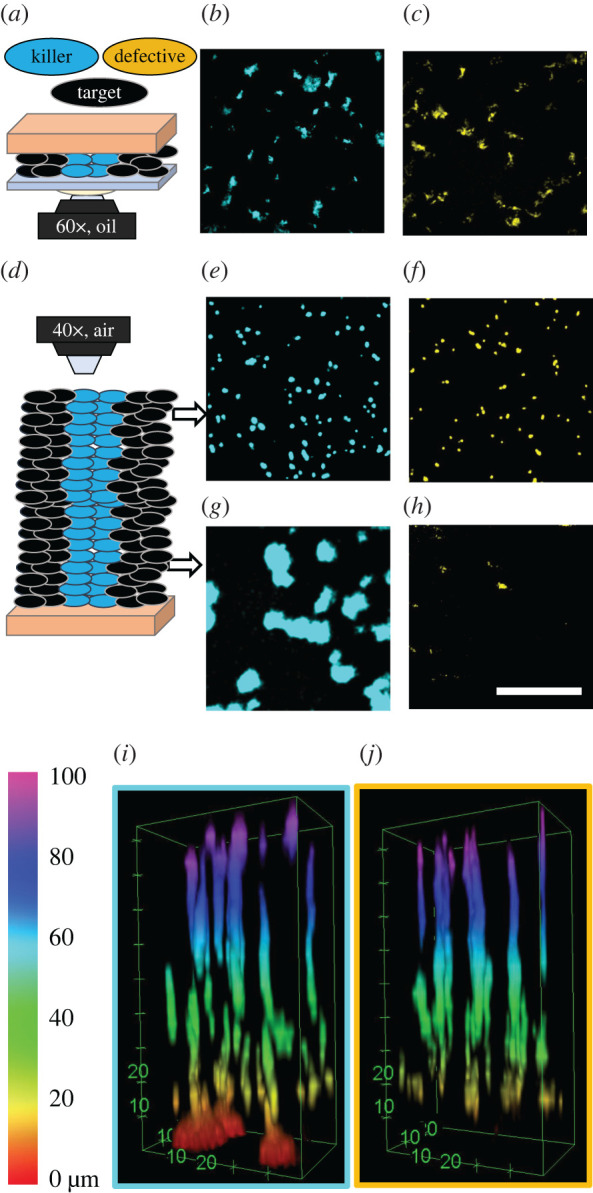
Figure 4.

Invasion of dense biofilms by individual cells imaged with confocal microscopy after 24 h of biofilm growth. Biofilms grew from a dense cell monolayer containing 1% fluorescent cells, which were either T6SS+ killer cells (marked blue) or T6SS− defective killer cells (marked yellow). The remaining 99% of the population were non-fluorescent target cells, appearing black. In a confined geometry (schematic in (a)), killer cells (b) expanded their population only approximately 1.50 times more than defective killer cells (c). In unconfined biofilms (schematic in (d)) the final abundance of fluorescent cells depended on the distance above the agar surface. At the top of the biofilm, killer cells (e) only expanded their population 1.16 times more than defective killer cells (f). At the bottom, the killer population (g) was 275 times larger than the defective killer population (h), which was almost absent. Scale bar b,c,e–h: 50 μm. (i,j) Three-dimensional stack of unconfined biofilms showing that killer (i) and defective killer (j) cells performed different only within the bottom ∼10 μm. The colour bar indicates the distance from the agar pad.
