. 2020 Nov 3;34(6):3187–3193. doi: 10.21873/invivo.12154

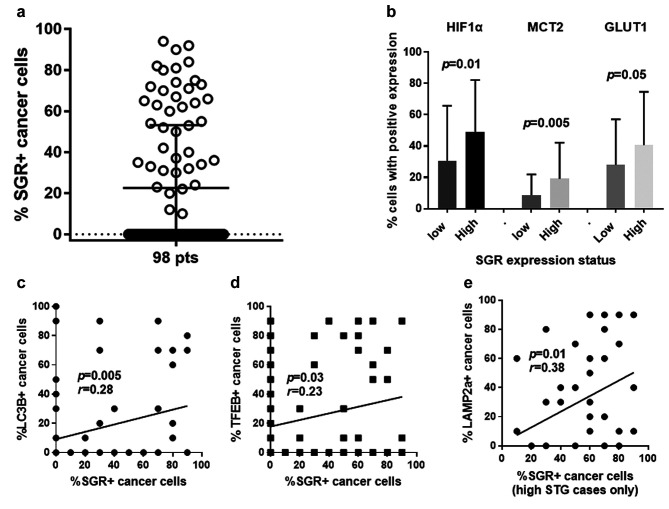
Figure 2. Statistical analysis figures: (a) Distribution of the percentage of cancer cells expressing strongly STG among 98 cases; (b) Percentage of cancer cells expressing HIF1α, MCT2 and GLUT1 according to the expression status of STG; (c) Linear regression analysis of the percentage of cancer cells expressing STG vs. the percentage of cancer cells expressing LC3B; (d) Linear regression analysis of the percentage of cancer cells expressing STG vs. the percentage of cancer cells expressing TFEB; (e) Linear regression analysis of the percentage of cancer cells expressing STG vs. the percentage of cancer cells expressing LAMP2a, in cases with high STG expression.

Figure 2