. 2020 Nov 3;34(6):3205–3215. doi: 10.21873/invivo.12156

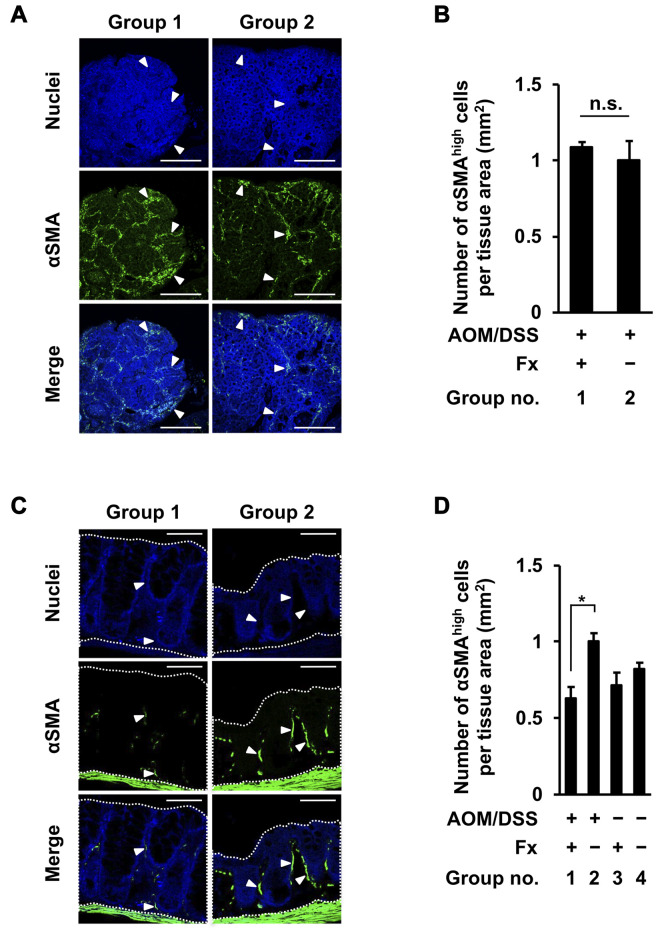
Figure 6. Immunohistochemical staining of cancer-associated fibroblast-like αSMAhigh cells in colonic adenocarcinoma and mucosal crypts in AOM/DSS mice with or without fucoxanthin (Fx). The nuclei (blue fluorescence) and αSMA (green fluorescence) were observed by confocal microscopy. (A, C) Representative confocal images of αSMAhigh cells in the colonic adenocarcinoma and mucosal crypts, respectively. White arrowheads show particularly accumulated αSMAhigh cells. Bars are 50 μm. (B, D) The expression level of αSMA per tissue area (mm2) in colonic adenocarcinoma and mucosal crypts (dotted line enclosed area) was estimated as -fold by calculating the relative imaging density by normalizing to the value of the control mice (group 2), respectively. (B) Means±SE (n=3 and 7 in group 1 and 2, respectively). No significance (n.s.) by Wilcoxon rank sum test. (D) Means±SE (n=5). *p<0.05 by one-way ANOVA with post-hoc Tukey-Kramer test.

Figure 6