
Fig. 3. PCA variables plot.
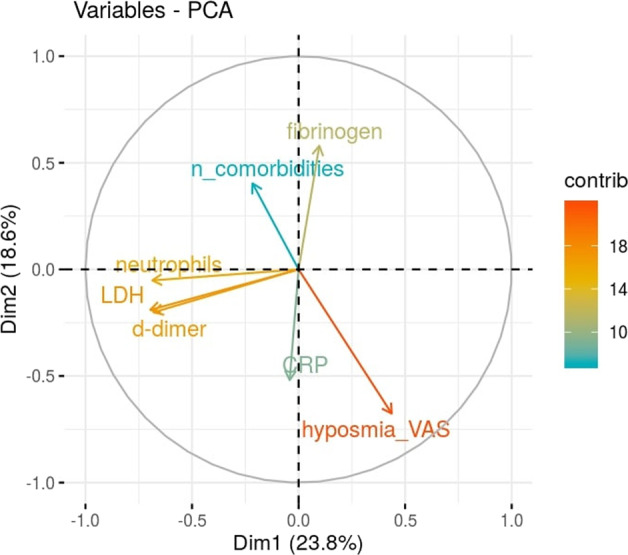
Eigenvector-based coordinates of the original variables in the two-dimensional space defined by the first two principal components. The relative position of the clinical variables reflect their relationship (positive correlated variables point to the same side of the plot; negative correlated variables point to opposite sides of the plot), while the length of the arrow is proportional to their contribution to the principal components.