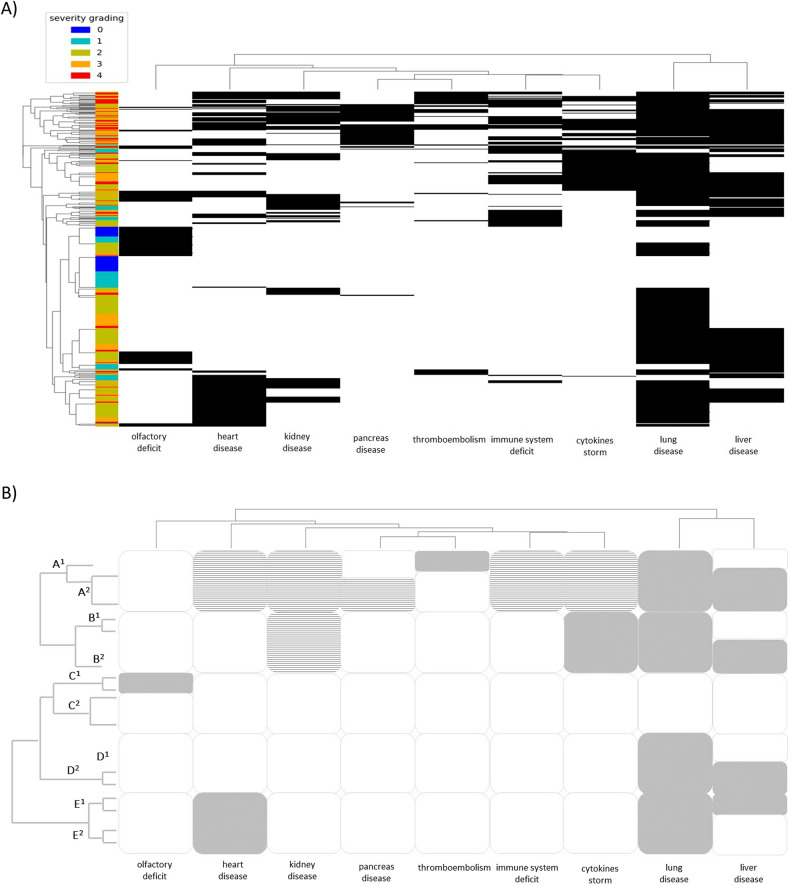
Fig. 4. Phenotypic clustering of COVID-19 patients.
A Dendrogram of COVID-19 patients’ clinical phenotypes by hierarchical clustering of organ/system involvement. B Drawing of the above reported graph helping interpretation and simplification in the main branch of the tree. A1 severe multisystemic with either thromboembolic; A2 severe multisystemic with pancreatic variant; B1 cytokine storm with moderate liver involvement; B2 cytokine storm with severe liver involvement; C1 mild with hyposmia; C2 mild without hyposmia; D1 moderate without liver damage; D2 moderate with liver damage; E1 heart with liver damage; E2 heart without liver damage.

