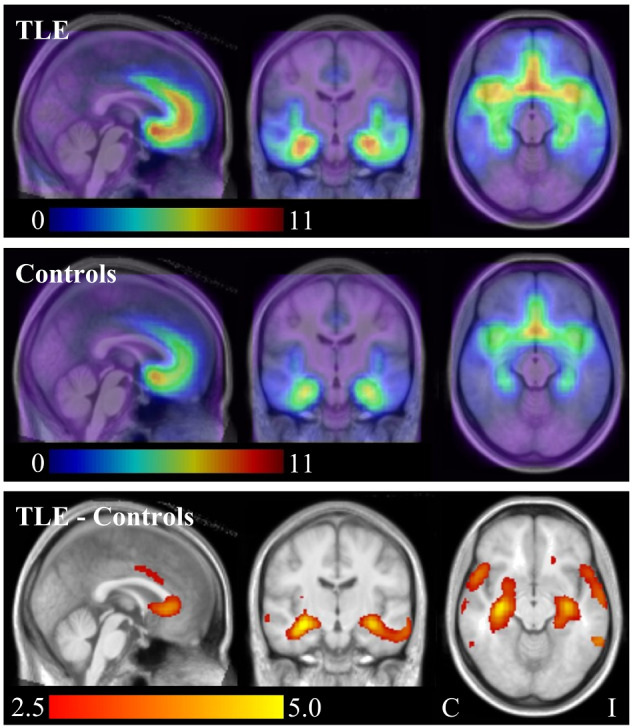
Figure 1.

Significant differences in [11C]Ro15-4513 VS (individuals with MRI-negative TLE versus healthy controls). Top row—median for the TLE group (with flipping; ipsilateral is on the right of the image/left of the brain throughout); middle row—median for the control group; Bottom row—significant differences in VS between the groups (red/yellow colour scale—TLE > Controls; cluster pseudo-T threshold 2.5). Bottom row depicts the median pseudo-T statistic image (10 random control flips). C, contralateral; I, ipsilateral
