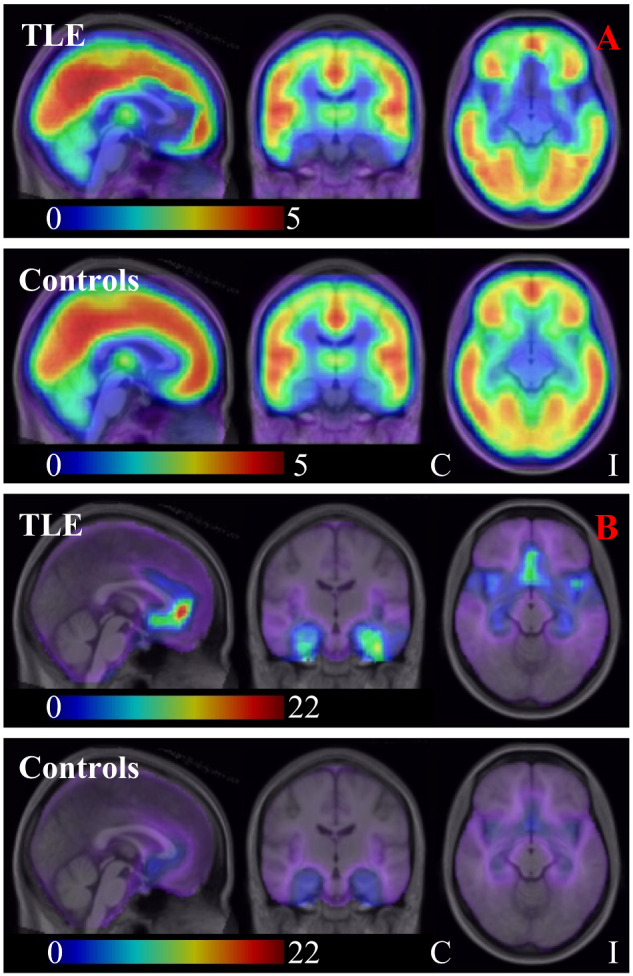
Figure 2.

[11C]Ro15-4513 VF (A) and VS: VF ratio (B; individuals with MRI-negative TLE versus healthy controls). (A) median VF for the TLE group (upper row; with flipping; ipsilateral is on the right of the image/left of the brain throughout) and for the control group (lower row); (B) median VS: VF ratio for the TLE group (upper row; with flipping; ipsilateral is on the right of the image/left of the brain throughout) and for the control group (lower row). Note that in B, for illustrative purposes, we depict VS: VF ratio rather than VF: VS ratio. C, contralateral; I, ipsilateral
