Figure 4.

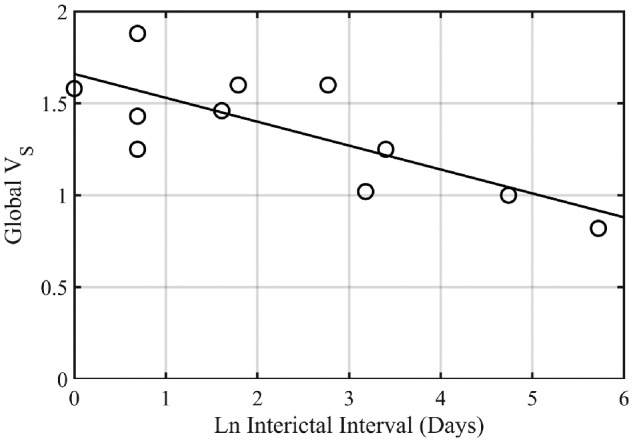
Global VS versus interictal interval. The interictal interval has been transformed via the natural logarithm (Ln). Pearson’s correlation coefficient (r) was −0.77 (P = 0.005). VS, slow component volume of distribution.

Global VS versus interictal interval. The interictal interval has been transformed via the natural logarithm (Ln). Pearson’s correlation coefficient (r) was −0.77 (P = 0.005). VS, slow component volume of distribution.