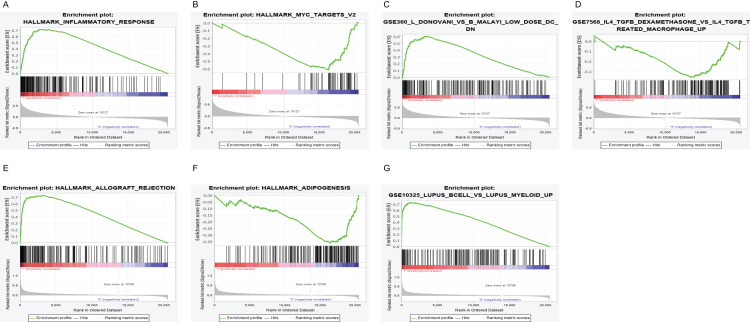
Figure 6. GSEA for samples with high PTPRC/CD19 expression and low expression.
(A) The enriched gene sets in HALLMARK collection by the high PTPRC expression sample. Up-regulated genes on the y-axis approaching the origin of the coordinates; by contrast, the down-regulated lay on the x-axis. Only gene sets with NOM p < 0.05 and FDR q < 0.25 were considered signifificant. Several leading gene sets were displayed in the plot. (B) The enriched gene sets in HALLMARK by samples with low PTPRC expression. (C) Enriched gene sets in C7 collection, the immunologic gene sets, by samples of high PTPRC expression. Several leading gene sets are shown in plot. (D) Enriched gene sets in C7 by the low PTPRC expression. (E) The enriched gene sets in HALLMARK collection by the high CD19 expression sample. (F) The enriched gene sets in HALLMARK by samples with low CD19 expression. (G) Enriched gene sets in C7 by the high CD19 expression.

