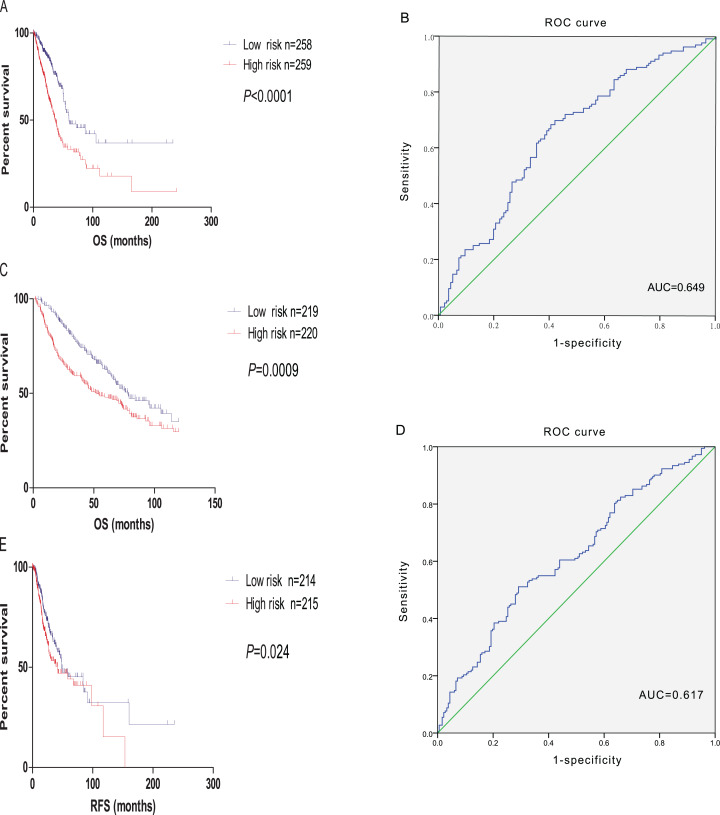
Figure 8. Validation of the prognostic model.
(A) The Kaplan–Meier survival analysis of the prognostic model for LUAD samples from TCGA. (B) ROC curve of the prognostic model in LUAD samples from TCGA. (C) The Kaplan–Meier survival analysis of the prognostic model for LUAD samples from GSE68465. (D) ROC curve of the prognostic model in LUAD samples from GSE68465. (E) The Kaplan–Meier survival analysis of the prognostic model with relapse free survival for LUAD samples from TCGA.

