FIGURE 2.

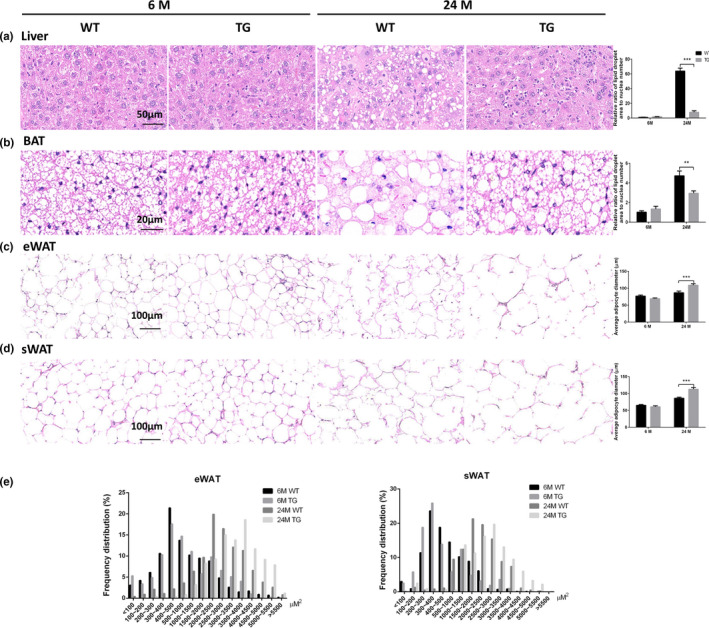
SPATA4 regulates fat distribution during aging. Histological changes were observed by H&E staining. (a) Representative images show lipid accumulation in liver tissues, and the ratio of lipid droplet area to the cell number was calculated. (b) The distribution of lipid droplets in brown adipose tissue (BAT) is shown, and the area ratio to cell number was calculated. Representative images show the morphology and diameter of adipocytes in epidydimal white adipose tissue (eWAT) (c) and subcutaneous white adipose tissue (sWAT) (d). (e) The area of each adipocyte in the view was calculated as described in the Section 2. The ratio of adipocytes within some range of area to the total adipocytes in the view was shown. N = 6, **p < 0.01, ***p < 0.001
