Figure 3.

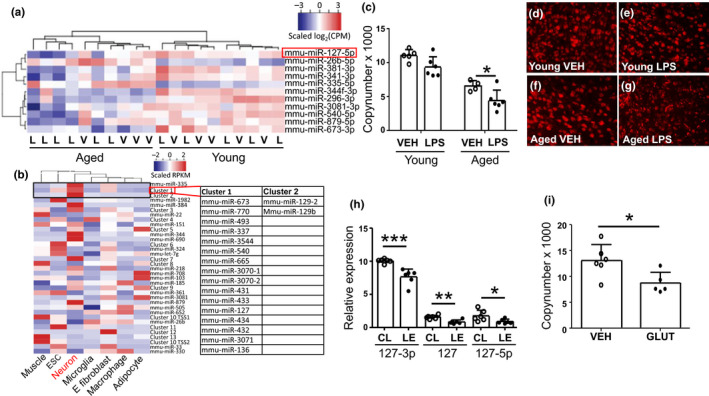
miR‐127 was dysregulated in the PI‐area of aged mice treated with LPS, in lesion samples from ischemic human brains, and in the cortical neuron culture treated with glutamate. Significant mature miRNA species in LPS‐treated aged mice (a). The mature miRNA species have been filtered to include only miRNAs derived from active loci based on neuron GRO‐seq data (b). Figure b depicts the tissue‐specific expression of miRNA loci in mouse. Significant miRNA loci in aged LPS‐treated mice where neuron‐specific transcription has been confirmed by GRO‐seq. For miRNA clusters, the cluster members are listed in Table S2. The three top loci represent top expressed, neuron‐specific miRNAs in neurons (ESC = embryonic stem cell, E fibroblast = embryonic fibroblast). MiR‐127 was significantly downregulated in brains of aged, ischemic mice with peripheral inflammation (c). Representative pictures of miR‐127 fluorescent in situ–hybridization from PI‐area of young vehicle (d), young LPS (e), aged vehicle (f), and aged LPS‐treated mice (g). Similar downregulation was observed as well in samples from human lesion area (h) and primary cortical neurons treated with glutamate 400 µM (i). The data are shown as mean±SD. V or VEH = Vehicle treatment, L or LPS = LPS treatment, CPM = counts per million, RPKM = reads per million kilobase, TSS = transcription start site, CL = contralateral, LE = lesion, GLUT = glutamate treatment 400 µM *p < 0.05 **p < 0.01 ***p < 0.001 (c) F(1, 17) = 69.64 p < 0.0001 age effect; F(1, 17) = 11.58 p = 0.003 treatment effect of two‐way ANOVA followed by Holm–Sidak's multiple comparisons test, adjusted p = 0.036 n = 4–6 (h) 127‐3p: t(10) = 4.84 p = 0.0007 n = 6 unpaired two‐tailed t‐test; 127: t(10) = 4.24 p = 0.002 n = 6 unpaired two‐tailed t‐test; 127‐5p: t(10) = 2.33 p = 0.042 n = 6 unpaired two‐tailed t‐test (i) t(9) = 2.69 p = 0.025 n = 5–6 unpaired two‐tailed t‐test
