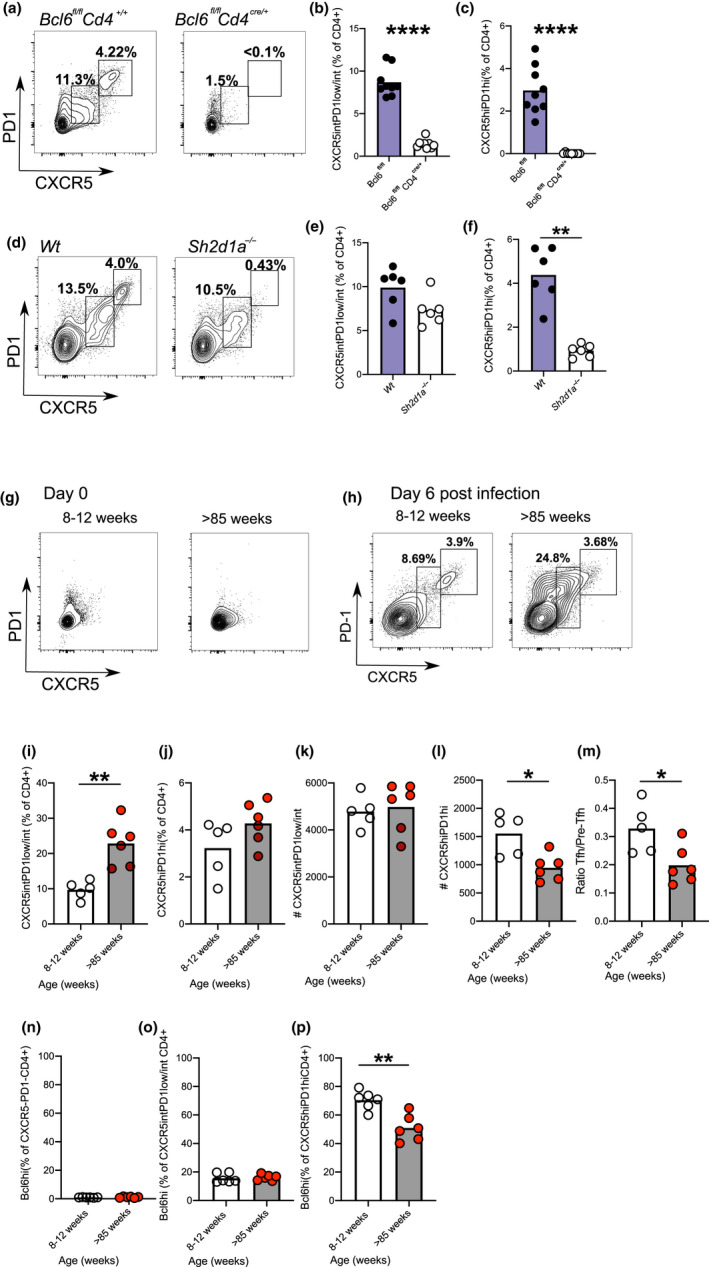
FIGURE 1.

Age promotes pre‐Tfh cell differentiation in mice. Representative flow plots showing CXCR5 and PD‐1 expression on CD4+ cells isolated from draining lymph nodes of Bcl6 fl / flCd4 +/+ and Bcl6 fl / flCd4cre /+ mice on day 14 postinfluenza A virus infection (a) and graphs showing percentage of pre‐Tfh (b; CXCR5+PD‐1low/int) and GC‐Tfh cells (c; CXCR5hiPD‐1+). Representative flow plots showing CXCR5 and PD‐1 expression on CD4+ cells isolated from draining lymph nodes of Wt and Sh2d1a −/− mice on day 14 postinfluenza A virus infection (d) and graphs showing percentage of pre‐Tfh (e) and GC‐Tfh (f) cells. Representative flow plots showing CXCR5 and PD‐1 expression on CD4+ T cells from inguinal lymph nodes in unimmunised 8‐ to 12‐week‐old and >85‐week‐old mice (g). Flow plots showing the pre‐Tfh and GC‐Tfh cells present in draining lymph nodes of 8‐ to 12‐week‐old and >85‐week‐old C57Bl/6 mice on day 6 postinfluenza A virus infection (h). Percentages of pre‐Tfh cells (i) and GC‐Tfh cells (j), numbers of pre‐Tfh (k), GC‐Tfh cells (l) and ratio of pre‐Tfh to GC‐Tfh cell number (m) in draining lymph nodes of 8‐ to 12‐week‐old and >85‐week‐old mice on day 6 postinfection. Percentages of naïve/effector (n), pre‐Tfh (o) and GC‐Tfh (P) CD4+ T cells expressing Bcl6 of draining lymph nodes from 8‐ to 12‐week‐old and >85‐week‐old mice on day 6 postinfection. Each symbol is representative of an independent biological replicate, and the height of the bar represents the mean. Statistics were calculated using Mann–Whitney U test *p < 0.05, **p < 0.005, ***p < 0.0005
