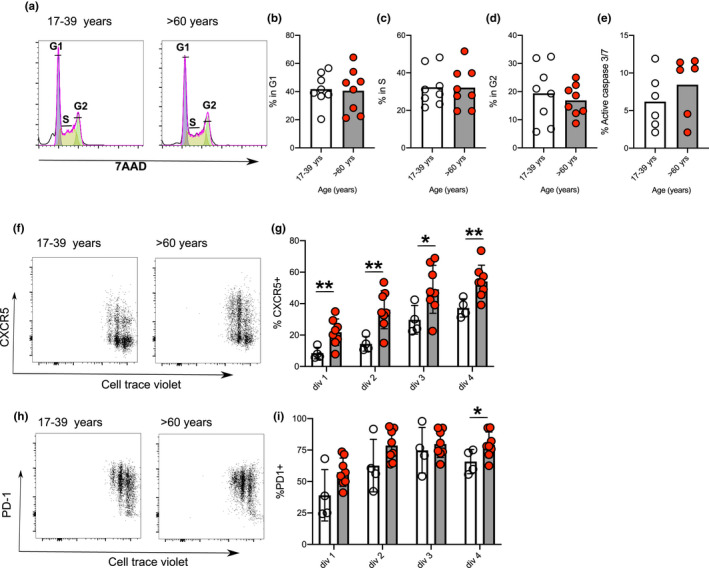
FIGURE 3.

Effect of age on cell cycle, death and expression of CXCR5 and PD‐1 in human CD4+ T cells. Representative flow plots showing cell cycle analysis at 44 hr postactivation (a). Bar graphs showing percentage of cells in different stages of cell cycle: G1 (b), S (c) and G2 (d) and percentage of cells positive for caspase 3/7 staining (e) 48 hours after activation of naïve CD4+ T cells from younger (clear circles) and older (red circles) donors. Expression of CXCR5 (f, g) and PD‐1 (h, i) relative to CTV dilution 72 hr after activation of naïve CD4+ T cells from younger (clear circles) and older (red circles) donors. Each symbol is representative of individual values from independent donors, the height of the bar represents the mean, and statistics were calculated using Mann–Whitney U or Kruskal–Wallis test *p < 0.05, **p < 0.005
