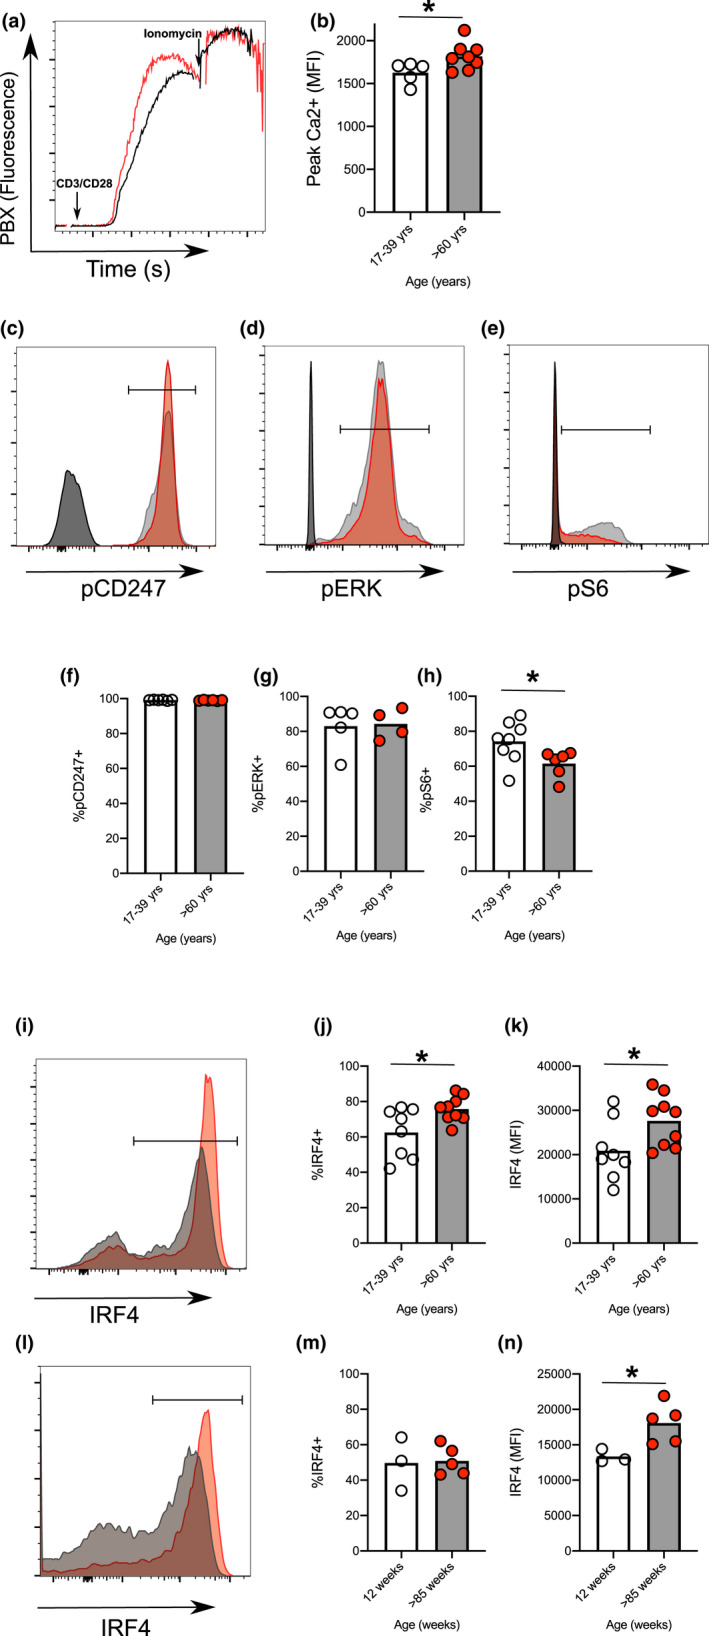
FIGURE 4.

Ageing changes the response to activation of human and murine naïve CD4+ T cells. Representative flow plot (a) and quantitation (b) of calcium flux after CD3/CD28 cross‐linking induced flux in human naïve T cells taken from younger (clear circles) and older (red circles) donors. Representative flow plots of pCD247 (c), pERK (d) and pS6 (e) after CD3/CD28 cross‐linking induced stimulation of human naïve T cells taken from younger (grey line) and older (red line) donors at 10 min compared with unstimulated older donors (black line). Percentage of cells positive for pCD247 (f), pERK (g) and pS6 (h) following 10 min of CD3/CD28 activation in human naïve CD4+ T cells from younger (clear circles) and older (red circles) donors. Representative histograms and graphs showing levels of IRF4 expression in human naïve CD4+ T cells from younger and older donors 20 hr postactivation with CD3/CD28 (i‐k). Representative histograms showing levels of IRF4 expression expressed 20 hr post‐CD3/CD28 activation of mouse naïve CD4+ T cells purified from spleens of 8‐ to 12‐week‐old and >95‐week‐old mice 20 hr (l‐n). Statistics were calculated using Mann–Whitney U test *p < 0.05
