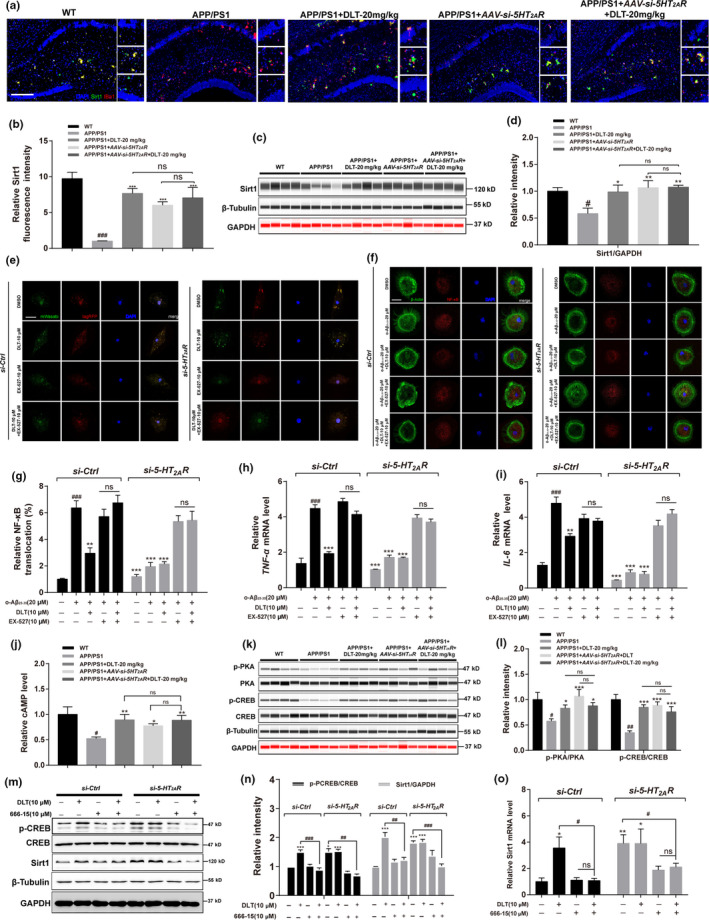
FIGURE 5.

DLT treatment promoted autophagy and suppressed inflammation in APP/PS1 mice through 5‐HT2AR/cAMP/PKA/CREB/Sirt1 pathway. (a) Immunofluorescence assay and (b) its quantification results demonstrated that treatment of DLT or AAV‐si‐5HT2AR increased the protein level of Sirt1 in the hippocampus (CA1 region) of APP/PS1 mice (n = 4). Scale bar: 100 µm. (c) Jess and (d) its quantification results demonstrated that treatment of DLT or AAV‐si‐5HT2AR increased the protein level of Sirt1 in the brains of APP/PS1 mice (n = 4). (e) The results of autophagic flux assay demonstrated that DLT or si‐5HT2AR‐induced autophagy stimulation was abolished by co‐treatment of Sirt1 inhibitor Ex‐527 (n = 4). Scale bar: 5 µm. (f) Immunofluorescence assay and (g) its quantification results demonstrated that co‐treatment of Ex‐527 abolished the suppression of NF‐κB nuclear translocation induced by treatment of DLT or si‐5HT2AR in primary microglia (n = 4). Scale bar: 5 µm. (h, i) RT‐PCR results demonstrated that co‐treatment of Ex‐527 abolished the suppression of inflammatory cytokines transcription induced by treatment of DLT or si‐5HT2AR in primary microglia (n = 3). (j) Treatment of DLT or AAV‐si‐5HT2AR increased cAMP level in the brains of APP/PS1 mice (n = 5). (k) Jess assay and (l) its quantification results demonstrated that treatment of DLT or AAV‐si‐5HT2AR increased the level of phosphorylated PKA/CREB in the brains of APP/PS1 mice (n = 4). (m) Western blot assay and (n) its quantification results demonstrated that co‐treatment of CREB inhibitor 666–15 abolished the upregulation of Sirt1 protein level induced by treatment of DLT and si‐5HT2AR in BV2 cells (n = 3). (o) RT‐PCR results demonstrated that co‐treatment of CREB inhibitor 666–15 abolished the upregulation of Sirt1 mRNA level induced by treatment of DLT and si‐5HT2AR in BV2 cells (n = 3). All values were presented as the mean ± SEM. For animal tissue assays, # p < 0.05, ### p < 0.001 compared with WT group by t test. *p < 0.05 compared with APP/PS1 group by two‐way ANOVA. For cell assays, ### p < 0.001 compared with si‐Ctrl, **p < 0.01, ***p < 0.001 compared with si‐Ctrl+o‐Aβ25‐35 by one‐way ANOVA
