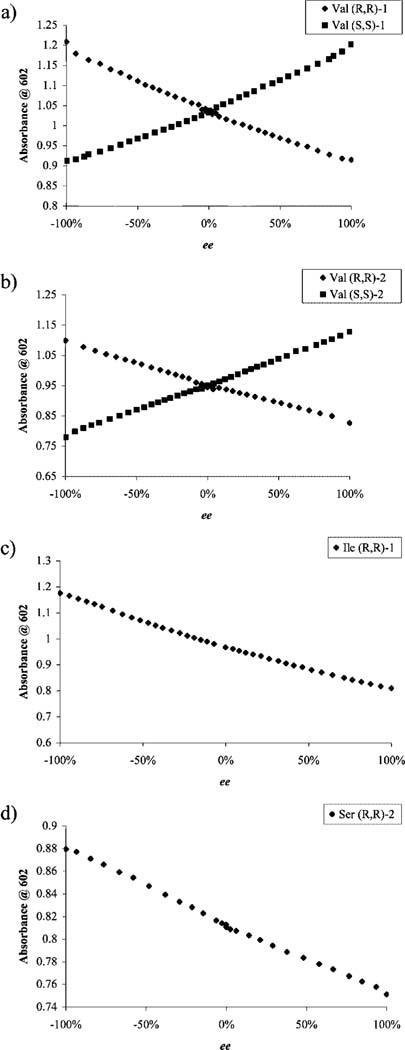
Figure 8.
Enantiomeric excess calibration curves obtained using a UV-vis spectrophotometer. (a) Overlay of the two ee calibration curves for (R,R)-1 and (S,S)-1: absorbance at 602 nm as a function of ee for displacement experiments performed with the addition of valine (714 μM) into a solution containing CAS (10 μM), Cu(OTf)2 (200μM), and 1 (2.5 mM) in 1:1 MeOH:H2O, 50 mM HEPES buffered to pH 7.5. (b) Overlay of two ee calibration curves for (R,R)-2 and (S,S)-2: absorbance at 602 nm as a function of ee for displacement experiments performed with the addition of valine (125 μM) into a solution containing CAS (10 μM), Cu(OTf)2 (105 μM), and 2 (8.8 mM) in 1:1 MeOH:H2O, 50 mM HEPES buffered to pH 7.5. (c) Absorbance at 602 nm as a function of ee for displacement experiments performed with the addition of isoleucine (697 μM) into a solution containing CAS (10 μM), Cu(OTf)2 (200 μM), and (R,R)-1 (2.5mM) in 1:1 MeOH: H2O, 50 mM HEPES buffered to pH 7.5. (d) Absorbance at 602 nm as a function of ee for displacement experiments performed with the addition of serine (125 μM) into a solution containing CAS (10 μM), Cu(OTf)2 (105 μM), and (R,R)-2 (8.8 mM) in 1:1 MeOH:H2O, 50 mM HEPES buffered to pH 7.5.

