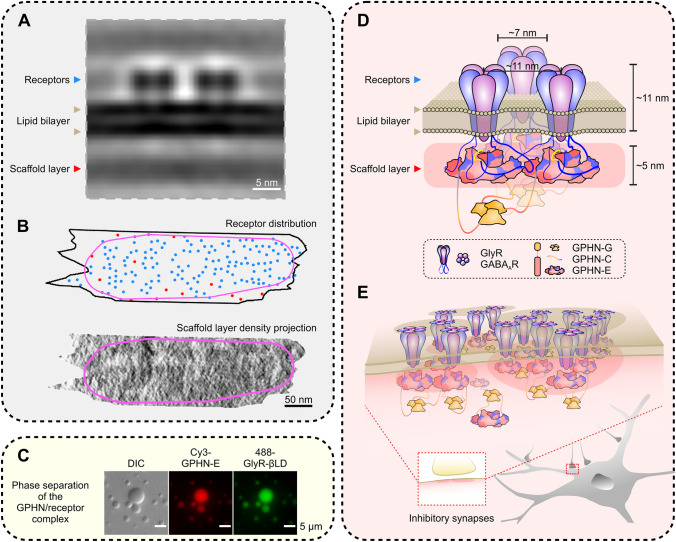
Fig. 1.
Gephyrin-mediated receptor clustering in inhibitory synapses via phase separation. A An example of the sub-tomogram average of GABAAR pairs in inhibitory synapses. B An example of GABAAR distribution on the postsynaptic membrane (upper panel) and the corresponding density projection of the scaffold layer (lower panel) (blue dots, clustered receptors; red dots, solitary receptors; magenta lines, boundary of the mesophase formed by the iPSD receptor and scaffold layers). C Representative differential interference contrast (DIC) and fluorescence images showing the phase separation of the gephyrin (GPHN)/GlyR complexes. D Model of interactions between gephyrin and GABAAR/GlyR pairs on the synaptic plasma membrane. The relative molecular scales are comparable to those in A. Note that the width of the gephyrin E-domain dimer is ~11 nm, and the distance between two GABAARs in iPSDs is also ~11 nm. E Diagram showing the formation of the iPSD sheet via phase separation.

