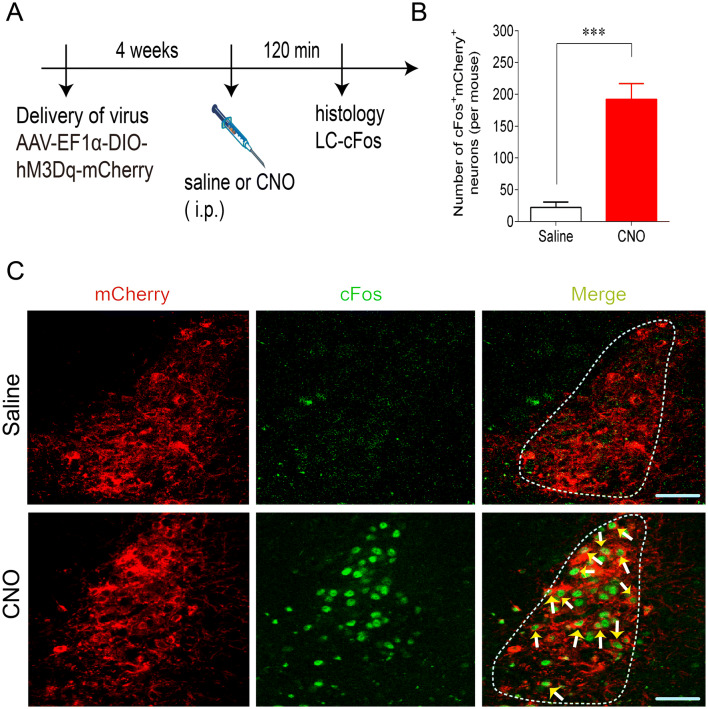
Fig. 3.
Histomolecular verification of Phox2bLC neuron activation. A Schematic of infection of Phox2b-Cre mice with AAV-EF1α-DIO-hM3Dq-mCherry by intraperitoneal injection of CNO or saline. B Numbers of cFos+mCherry+ neurons in CNO (1 mg/kg)-injected mice relative to saline-injected mice. Cell counts are from 6 coronal sections from each mouse (n = 4 per group) (***P < 0.001, unpaired t test). C Representative photomicrographs showing mCherry+ (red) and cFos+ (green) neurons in the LC. Immunoreactivity for cFos indicates CNO-activated neurons (arrows). Scale bars, 50 µm.

