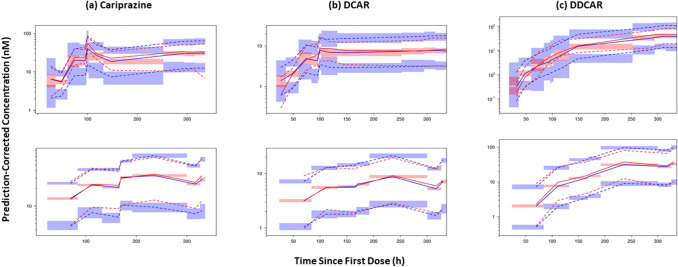
Fig. 3.
Prediction-corrected visual predictive check (PCVPC) of the final updated models. Visual predictive check of final models for 0–336 h since first dose for a cariprazine, b DCAR, and c DDCAR. PCVPC plots of phase 1 studies (top, multiple dose) and phase 3 studies (bottom, multiple dose) are shown separately. Red and blue lines denote observed data and predictions, respectively; solid lines denote median, dashed lines represent 5th and 95th percentiles; shaded areas represent 95% CI of prediction percentiles. CI confidence interval, DCAR desmethyl-cariprazine, DDCAR didesmethyl-cariprazine

