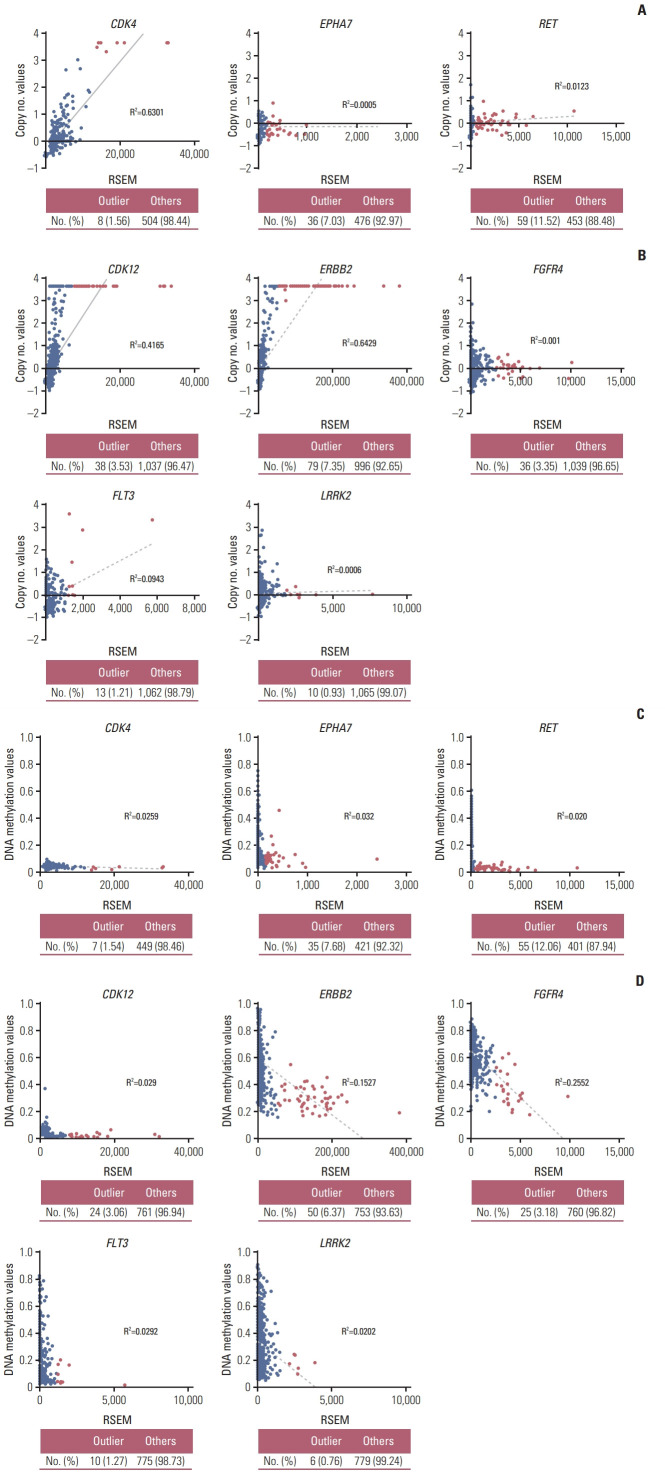
Fig. 2.
The causative mechanism of the overexpression of the outlier genes. Scatter plots of outlier kinase group-related DNA copy number and DNA methylation status in lung cancer (A, C) and breast cancer (B, D). Red and black circles indicate the outlier and others, respectively. Table shows the number of samples and percentage. These datasets are downloaded from The Cancer Genome Atlas. RSEM, RNA-seq by expectation maximization.

