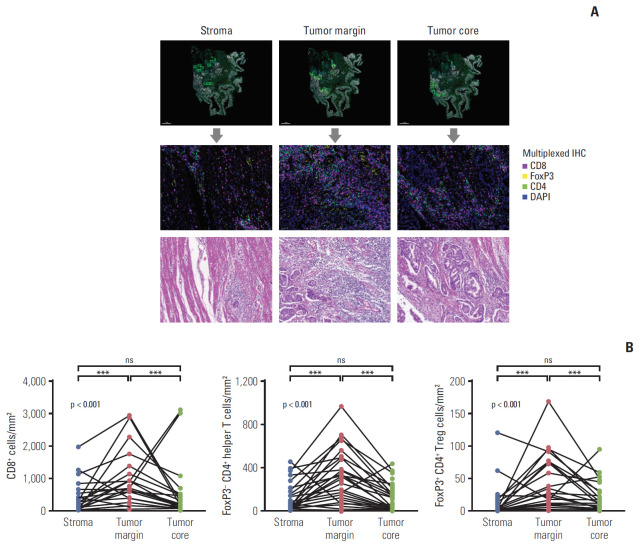
Fig. 1.
Quantification of the infiltration of T cell subsets according to the spatial distribution. (A) Representative image of multiplexed immunohistochemistry (IHC) demonstrating the selection of regions of interest and fluorescence imaging. (B) Spatial distribution patterns of CD8+ T cells, FoxP3− CD4+ helper T cells, and FoxP3+ CD4+ regulatory T cells (Treg) in the tumor core, tumor margin, and stroma. ***p < 0.001; ns, not significant.

