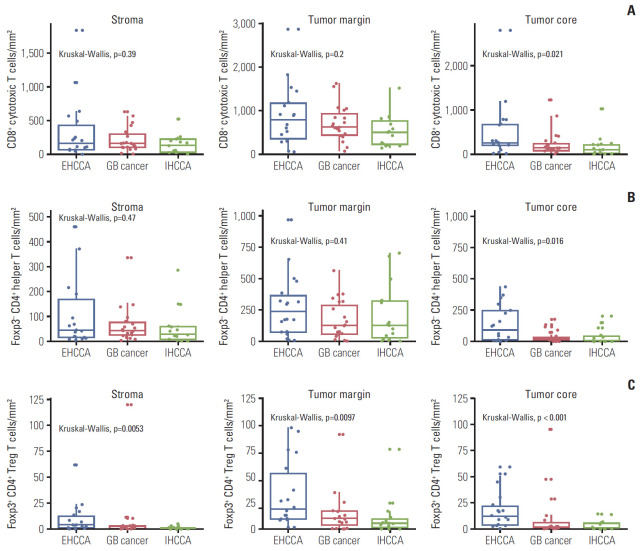
Fig. 3.
Comparison of the density of T cell subset infiltrates according to the primary tumor site. (A-C) The density of CD8+ T cells (A), FoxP3− CD4+ helper T cells (B), and FoxP3+ CD4+ regulatory T cells (Treg) (C) according to the primary tumor site. EHCCA, extrahepatic cholangiocarcinoma; GB, gall bladder; IHCCA, intrahepatic cholangiocarcinoma. *p < 0.05, **p < 0.01, ***p < 0.001.

