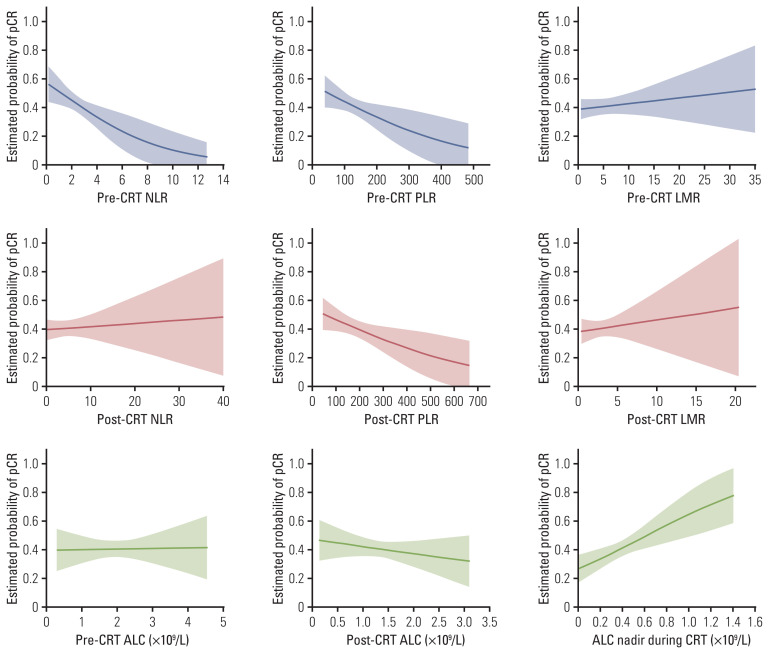
Fig. 3.
Model to represent the estimated probability of pathologic complete response (pCR) as a function of different hematological parameters based on logistic regression analysis. Shaded regions represent 95% point-wise confidence intervals. ALC, absolute lymphocyte count; CRT, chemoradiotherapy; LMR, lymphocyte to monocyte ratio; NLR, neutrophil to lymphocyte ratio; PLR, platelet to lymphocyte ratio.

