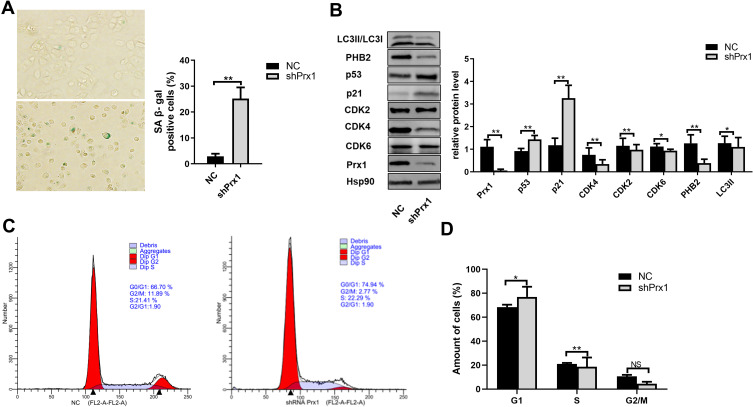
Figure 5.
Prx1 knockdown induced DOK cell senescence. (A) shPrx1 DOK cells are larger in appearance, with an increase in SA-β-gal-positive cells (*p<0.05, **p<0.01). (B) The expression of senescence and mitophagy-related proteins in shPrx1DOK cells. The relative levels of protein were normalized to Hsp90 used as an internal control. Values presented as means ±SD for three experiments (*p<0.05; **p<0.01). (C and D) Mitotic indices of DOK from NC and shPrx1 groups. Graphs represent the percentages of cells in G0/G1, S, and G2/M phases of the cell cycle. An increase in the percentage of cells in the G0/G1 phase and a decrease in the percentage of cells in the S phase can be observed in shPrx1 cells (*p<0.05, **p<0.01).

