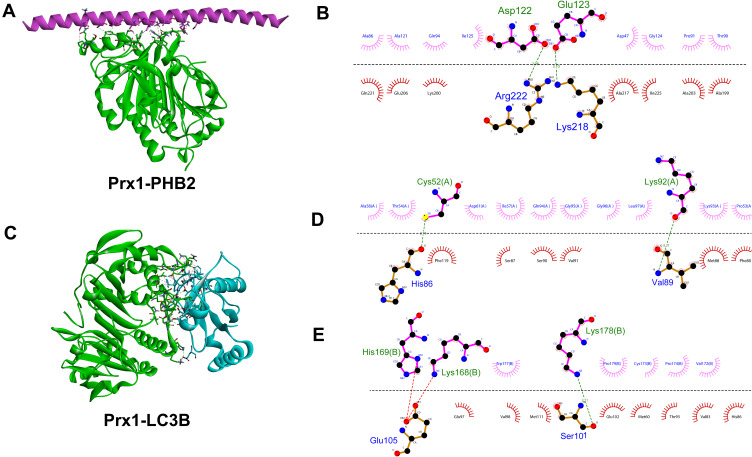
Figure 7.
The interaction between Prx1 and PHB2 or LC3B. (A) Structure of Prx1 bound to PHB2. Prx1 is shown in cyan, and PHB2 is shown in red. (B) Prx1-PHB2 interaction plot. Prx1 residues are shown in pink above the dashed line, and PHB2 residues are shown in red beneath the dashed line. Hydrogen bonds are shown as green dashed lines. The arcs represent the other residues involved in the Prx1 interaction. (C) Structure of Prx1 bound to LC3B. Prx1 is shown in cyan and LC3B is shown in blue (D and E). Prx1(A)-LC3B and Prx1(B)-LC3B interaction plot. Prx1 residues are shown in pink above the dashed line, and LC3B residues are shown in red beneath the dashed line. The images were constructed using Discovery Studio (DS) 2016 and Ligplot+ v.2.2.

