
Figure 3.
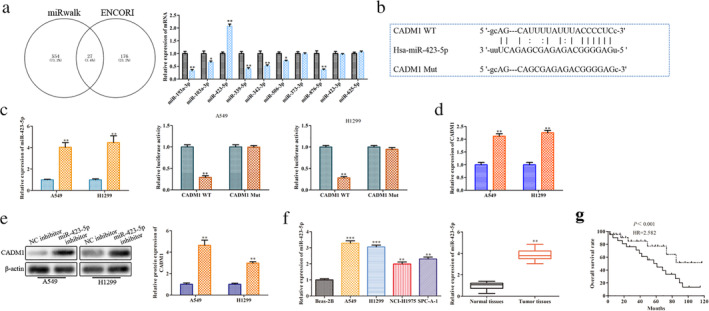
miR‐423‐5p targets CADM1 and causes post‐transcriptional suppression. A549 and H1299 cells were transfected with miR‐423‐5p mimic, miR‐423‐5p inhibitor, NC‐mimic and NC‐inhibitor. (a) Relative expression levels of 10 differentially expressed miRNAs  , Normal tissue;
  , Tumor tissue; *P < 0.05, **P < 0.01 versus normal tissues group. (b) The predicted miR‐423‐5p binding sites in the 3'‐UTR of CADM1 and the corresponding sequence were shown. (c) RT‐qPCR analysis of the transfection efficiency and relative values of luciferase signal
  , NC;
, NC;  , miR‐423‐5p mimic;
  , NC mimic;
  , miR‐423‐5p mimic;
  , NC mimic;
  , miR‐423‐5p mimic; **P < 0.01 versus NC mimic group. (d) Relative mRNA expression level of CADM1 in different transcription groups was detected by RT‐qPCR
  , NC inhibitor;
  , miR‐423‐5p inhibitor. (e) Relative protein expression level of CADM1 in different transcription groups was detected by western blot analysis
  , NC inhibitor;
  , miR‐423‐5p inhibitor; **P < 0.01 versus NC inhibitor group. (f) Relative expression levels of miR‐423‐5p in LUAD cells and LUAD tissues were detected by RT‐qPCR; **P < 0.01, ***P < 0.001 versus BEAS‐2B group. (g) Overall survival (OS) was used to evaluate the association between miR‐423‐5p expression levels with LUAD patients’ prognosis
  , High expression;
  , Low expression.