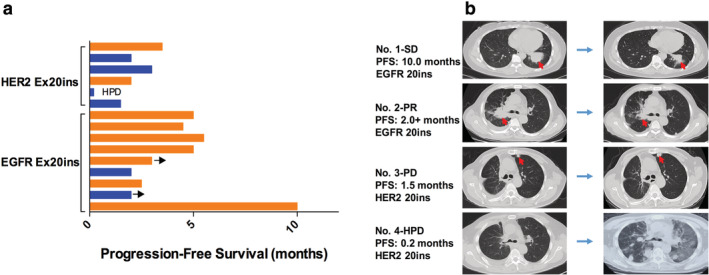
Figure 5.

(a) Swimmer plot for duration of disease stability or response to immune checkpoint inhibitors in patients with exon 20 mutation of EGFR or HER2. A total of 15 patients received immunotherapy including nine patients with EGFR Ex20ins and six with HER2 Ex20ins. Bar length indicates the duration of immunotherapy treatment for each patient, with the response observed before treatment failure indicated on the right. The origin corresponds to treatment start date, and the arrow indicates an ongoing response at the time of data censoring  , PD‐L1 ≥1%;
  , PD‐L1 <1%. (b) Computed tomography scans of the thorax performed prior (baseline) and after anti‐PD‐1 treatment onset in four patients. The red arrow shows the lung lesion.
