
Figure 1.
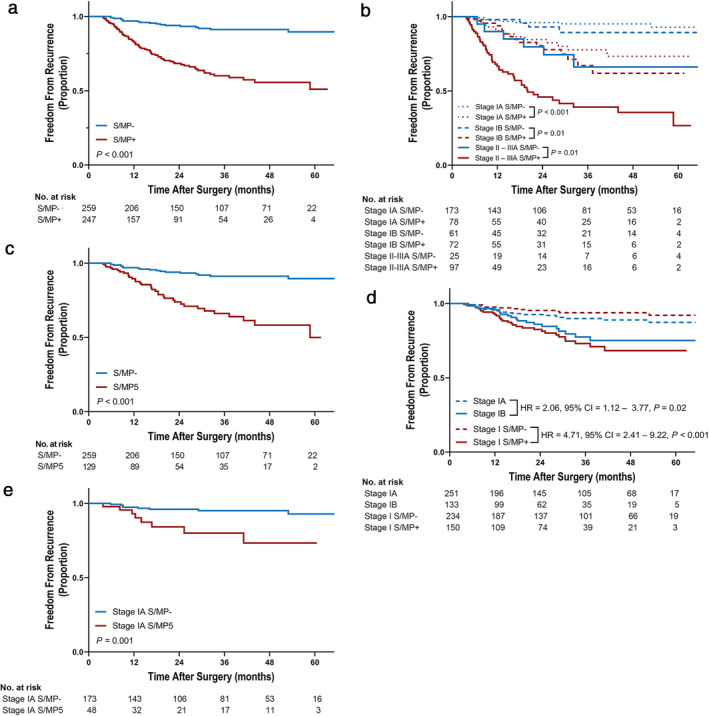
Kaplan‐Meier plots for freedom from recurrence according to S/MP subtype component. (a) S/MP+ vs. S/MP−  , S/MP−;
  , S/MP+, (b) S/MP+ vs. S/MP− in each stage
  , Stage IA S/MP−;
  , Stage IA S/MP+;
  , Stage IB S/MP−;
  , Stage IB S/MP+;
  , Stage II–IIIA S/MP−;
  , Stage II–IIIA S/MP+, (c) S/MP5 vs. S/MP−
  , S/MP−;
  , S/MP5, (d) Comparison of S/MP+ vs. S/MP− and IB vs. IA in stage I
  , Stage IA;
  , Stage IB;
  , Stage I S/MP−;
  , Stage I S/MP+, (e) S/MP5 vs. S/MP− in stage IA
  , Stage IA S/MP−;
  , Stage IA S/MP5. MP, micropapillary; S, solid; S/MP+, solid or micropapillary subtype present; S/MP−, both solid and micropapillary subtype absent; S/MP5, solid or micropapillary subtype proportion of 5% or less. P‐values by log‐rank test and hazard ratio (HR) and 95% confidence interval (CI) estimated by univariate Cox model.