
Figure 2.
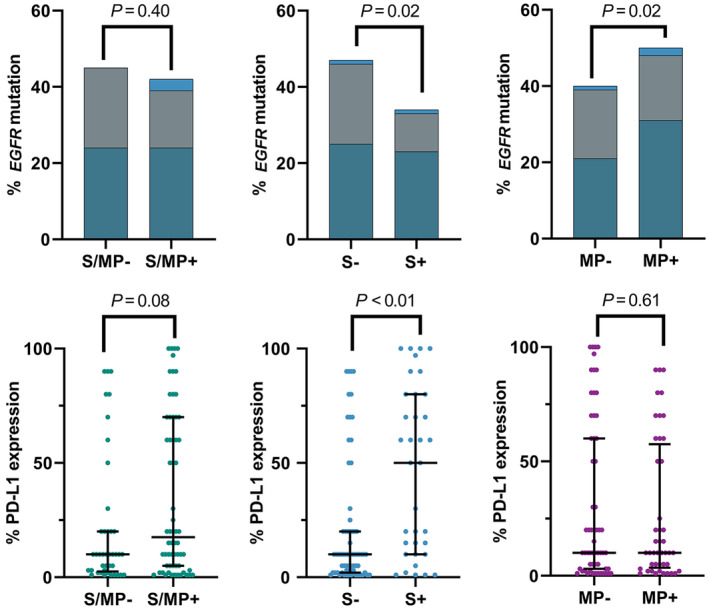
Comparison of (a) the frequency of EGFR mutation  , Exon 19;
  , Exon 21;
  , Others and (b) PD‐L1 expression level between solid and micropapillary subtypes. P‐values by χ2 tests (a), by Mann‐Whitney U test (b). Each dot represents one patient. Error bars represent the median ± quartile rage.