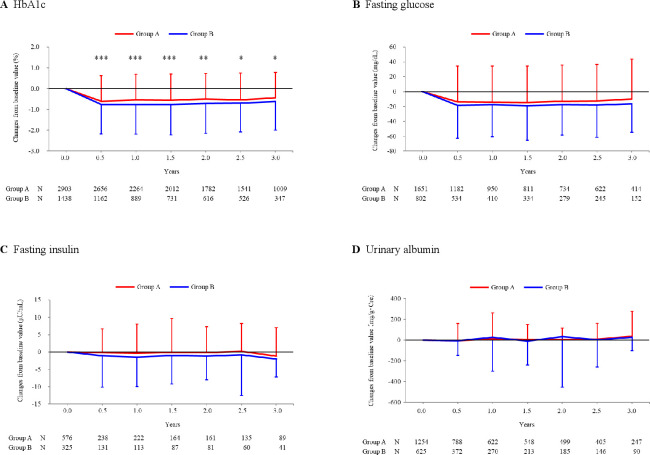
Figure 3.
Over-time changes of efficacy endpoints. HbA1c (A), fasting glucose (B), fasting insulin (C), and urinary albumin (D) were determined at baseline and following visits. Changes of these parameters from baseline (mean±SD) were plotted against each visit. Note the patients were excluded from the analysis if they received insulin products and/or GLP-1 or related formulations (group A), and received insulin products, GLP-1 or related formulations, and/or DPP-4 inhibitors (group B). Between-group difference was examined at each visit by two-sample t-test, giving significant p values only for HbA1c as ***p<0.001, ***p<0.001, ***p<0.001, **p=0.001, *p=0.026, and *p=0.027, respectively. Also note that mean HbA1c was 7.58% in group A patients and 7.86% in group B patients at baseline with significant difference (p<0.001 by 2-sample t-test; table 1). DPP, dipeptidyl peptidase; GLP-1, glucagon-like peptide-1; HbA1c, hemoglobin A1c.

