
Figure 4.
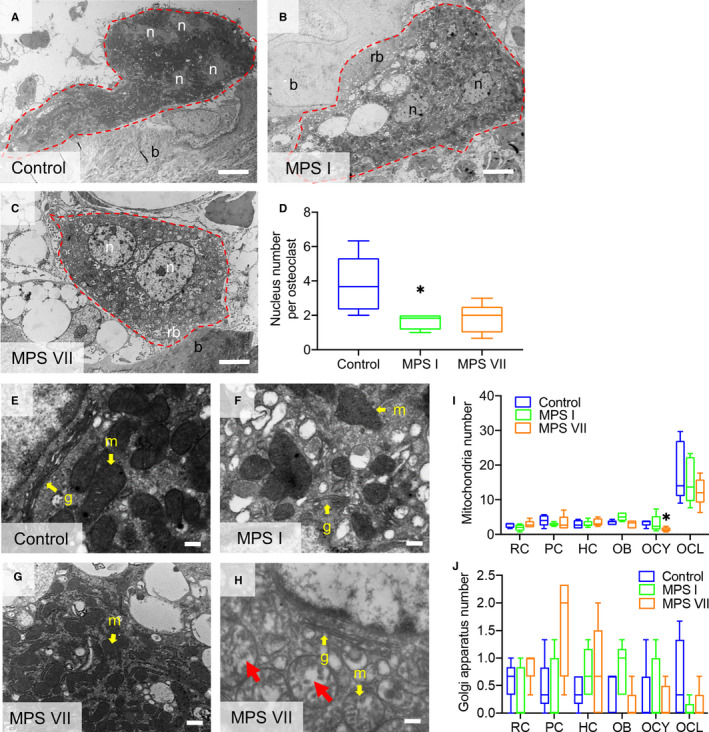
(A–C) Representative TEM images of osteoclasts in the calcified metaphyseal bone of 9‐day‐old control, MPS I and MPS VII dog vertebrae illustrating numbers of nuclei (n). Osteoclast borders are outlined (red dashed lines); b: bone matrix; and rb: ruffled border; Scale = 4 μm. (D) Quantification of the number of osteoclasts. (E–G) Higher magnification TEM images osteoclasts showing mitochondria (m) and Golgi bodies (G) (yellow arrows, examples). (H) A subset of mitochondria in MPS VII osteoclasts appeared swollen (red arrows, examples). (I) Quantification of the total numbers of mitochondria and (J) Golgi bodies in different skeletal cell types. RC: Resting chondrocytes in epiphyseal cartilage; PC and HC: proliferating and hypertrophic chondrocytes, respectively, in the growth plate; OB, OCY, and OCL: osteoblasts, osteocytes and osteoclasts, respectively, in calcified metaphyseal bone. Median, interquartile range (box), and 10th and 90th percentiles (whiskers); *p < 0.05 vs control; Kruskal–Wallis non‐parametric tests with Dunn's post hoc tests; n = 5