
Figure 2.
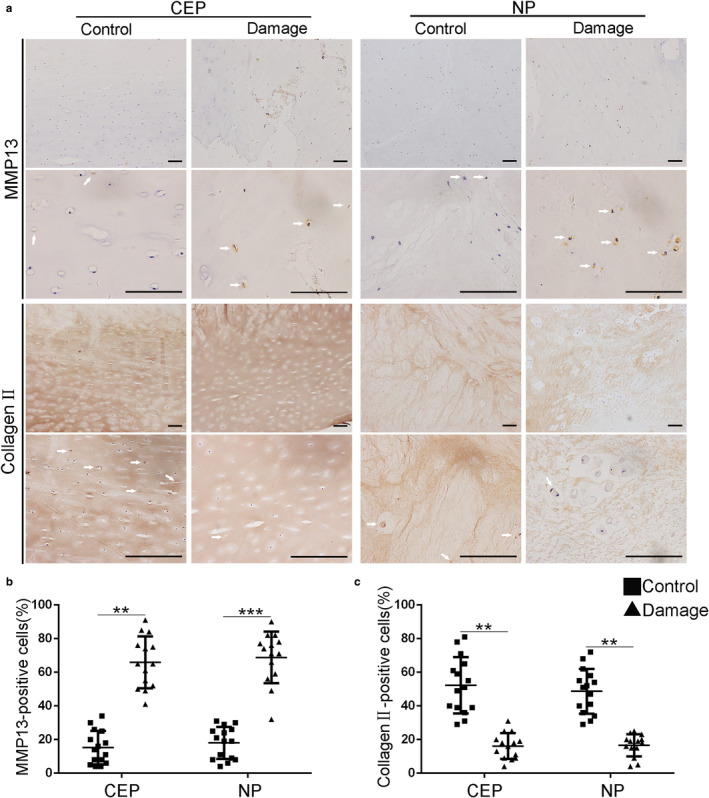
Micro‐damaged CEPs are associated with altered protein levels. (a) Immunopositive cells for MMP13 and Col II are compared visually in micro‐damaged (N = 14) and control (N = 15) tissues. Quantitative results show that damaged tissues contain a significantly higher % of cells positive for MMP13 (b) and a significantly lower % of cells positive for Col II (c). The white arrows represent the MMP13 or Collagen II‐positive cells. CEP, cartilaginous endplate; MMP, matrix metalloproteinase; Col II, type II collagen; NP, nucleus pulposus. Scale bar: 100 μm. *p < 0.05, **p < 0.01, ***p < 0.001