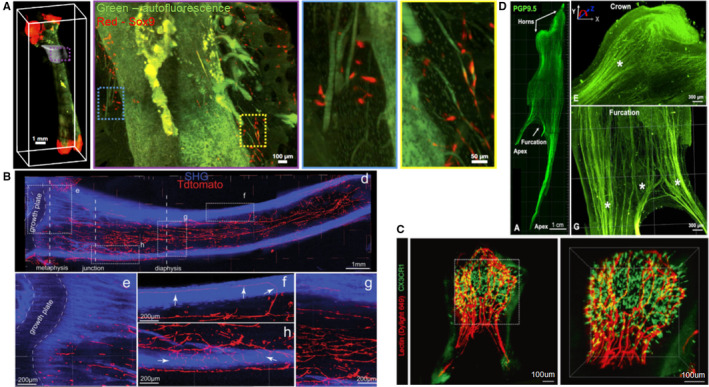
FIGURE 7.

Applications of tissue clearing in hard tissue organs. (a) Maximum intensity projection (MIP) fluorescence image of the femur revealing Sox9+ cells distribution in the vicinity of the third trochanter. Dotted boxed regions in the MIP represent progressive magnification. (b) Spatial distribution of nerves and arteries within the marrow space of the tibia. Dotted areas are magnified in e‐g. Arrows in f and h show nerve fibers penetrating the cortical bone. SHG, second harmonic generation signal. (c) Volumetric imaging of immune cell distributions in an upper third molar from a CX3CR1‐GFP transgenic mouse, with lectin labeled (red) endothelial cells in blood vessels. Maximal intensity Z‐projection image (left) and 3D reconstruction image (right) in the dotted area. (d) Tridimensional innervation of a human premolar (left) and high‐magnification images (right) of distinctive nerve splitting patterns in coronal and furcation direction. Images adapted from Refs (Greenbaum et al., 2017; Jing et al., 2018; Franca et al., 2019; Hong et al., 2019)
