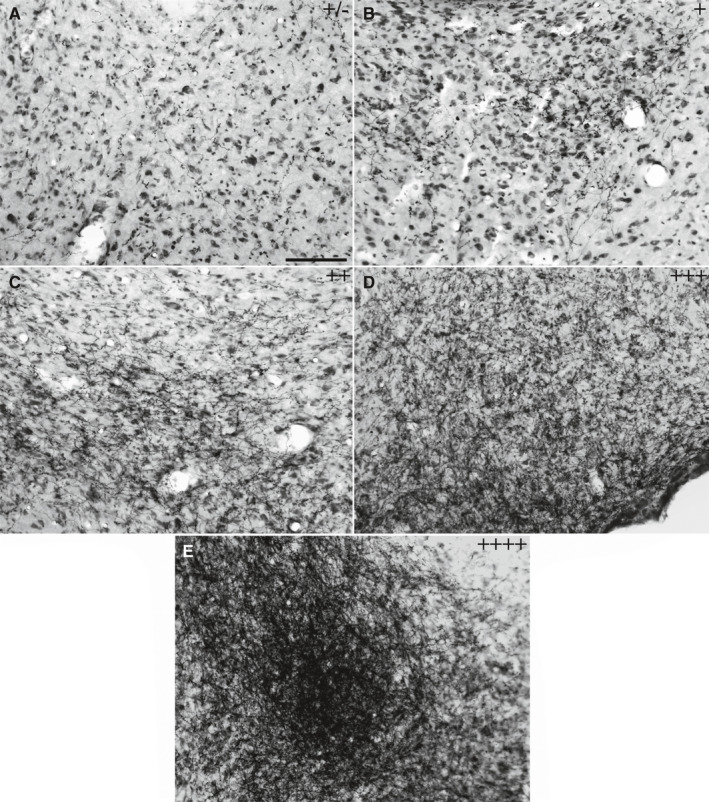
FIGURE 1.

Bright‐field photomicrographs of representative coronal brain sections showing the density of anterograde‐labelled fibres immunoreactive for PHA‐L, which was used for the semi‐quantitative analysis of the projections. Images represent the sparse or inconsistent (±) (a), low (+) (b), moderate (++) (c), high (+++) (d) or very high (++++) (e) density of fibres. Scale bar = 100 µm
