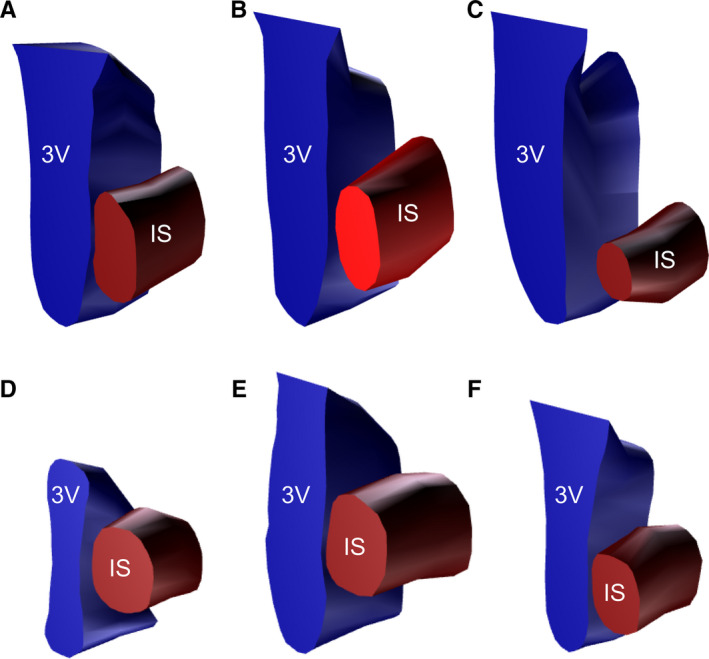
FIGURE 2.

Schematic 3D representation of injection sites of PHA‐L in the MPN of three control (a–c) and three OVX rats (d–f). Red edge, outer border of the PHA‐L injection; blue edge, outer border of the third ventricle. IS, injection site; 3V, third ventricle
