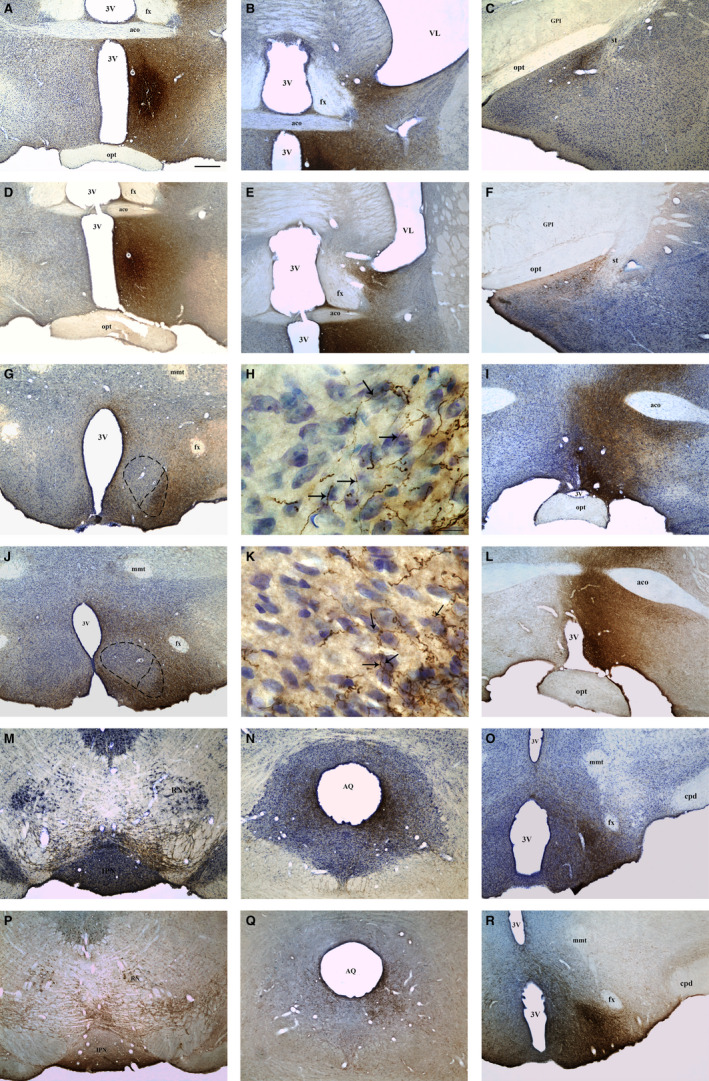
FIGURE 3.

Bright‐field photomicrographs of coronal brain sections representative of projecting areas immunoreactive for PHA‐L upon tracer injection in the MPN. Photomicrographs showing the injection site in the MPN of control (a) and OVX rats (d). Photomicrographs showing anterograde PHA‐L‐labelled fibres in the BNST (b), MeA (c), VMH (g), AVPV (i), VTA (m), PAG (n) and PMv (o) of control rats and in the BNST (e), MeA (f), VMH (j), AVPV (l), VTA (p), PAG (q) and PMv (r) of OVX rats. h, k Higher magnification of the VMH (g, j), respectively, showing the overlap of anterograde PHA‐L‐labelled fibres (arrows) with Nissl‐stained neuronal cell bodies in the VMHvl of control (h) and OVX rats (k). Dashed lines represent the boundaries of the MPN (a, d) and VMHvl (g, j). 3V, third ventricle; aco, anterior commissure; AQ, cerebral aqueduct; AVPV, anteroventral periventricular nucleus; BNST, bed nucleus of the stria terminalis; cpd, cerebral peduncle; fx, fornix; GPm, medial part of globus pallidus; IPN, interpeduncular nucleus; MeA, medial nucleus of the amygdala; mmt, mammillothalamic tract; MPN, medial preoptic nucleus; opt, optic chiasm; PAG, periaqueductal grey matter; PMv, ventral premammillary nucleus; RN, red nucleus; st, stria terminalis; VL, lateral ventricle; VTA, ventral tegmental area. Scale bars = 400 µm (a–g/i–j/l–r), 20 µm (h, k)
