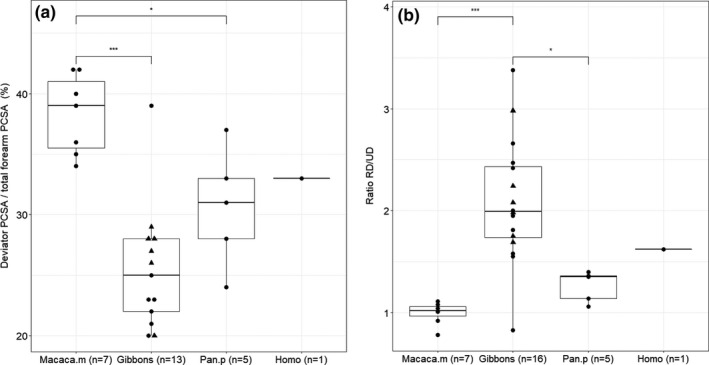
FIGURE 4.

Boxplot of the relative size of the radioulnar deviators. Within the hylobatid group, the triangles represent the siamangs. (a) The wrist deviators have a significantly higher PCSA in macaques compared to gibbons (p < .001) and bonobos (p < .05); (b) the ratio of radial deviators over ulnar deviators of gibbons is significantly higher than the ratio observed in macaques (p < .001) and bonobos (p < .05)
