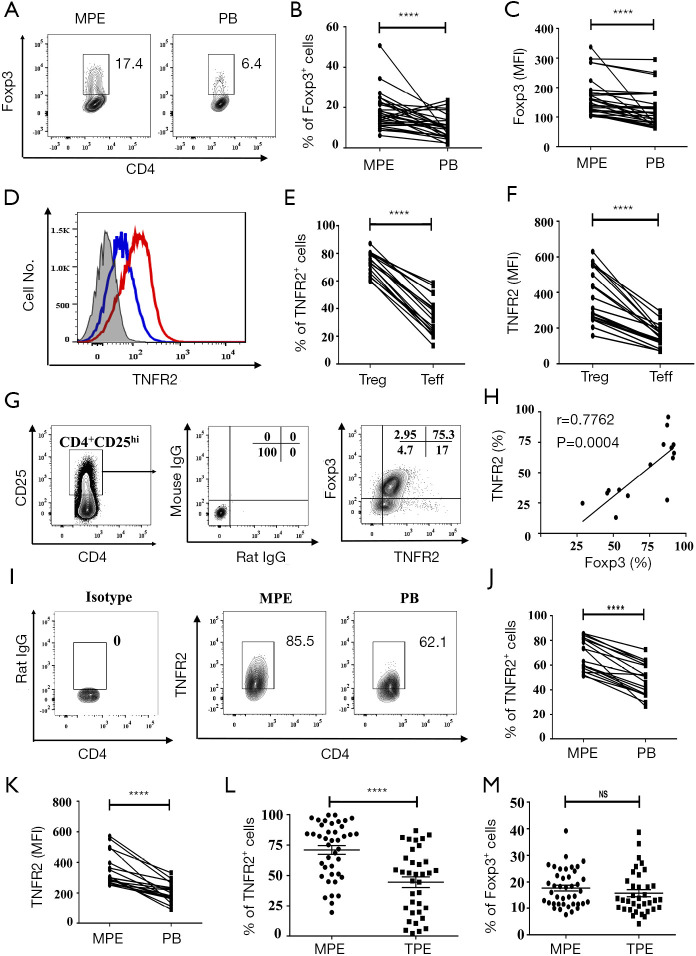
Figure 1.
High TNFR2 expression is a characteristic of MPE Tregs in lung cancer patients. (A) The representative proportion of Foxp3+Tregs were determined using FACS gated on live CD4+T cells. Comparisons of (B) the frequency and (C) the MFI of Foxp3 on CD4+T cells between MPE and blood (n=28). (D) Expression of TNFR2 on Tregs (CD4+Foxp3+; red line) and effector T cells (Teffs)(CD4+Foxp3-; blue line) in MPE. The shaded histogram depicts the isotype control. Comparisons of (E) the proportion of TNFR2+ cells and (F) TNFR2 MFI on Tregs and Tconvs (n=18). (G) Foxp3 and TNFR2 expressed by CD4+CD25hi T cells. (H) Correlation between the proportions of Foxp3+ cells and TNFR2+ cells present in CD4+CD25hi T cells in MPE (n=16). (I) Representative FACS analysis of TNFR2+ cells in Tregs from MPE and PB, gating for live CD4+Foxp3+cells. Comparisons of (J) TNFR2+ cells proportion and (K) TNFR2 MFI on Tregs in MPE and blood (n=18). Comparisons of (L) the proportion of TNFR2+ cells in Tregs and (M) the proportion of total Tregs in CD4+T cells between MPE (n=41) and TPE (n=36). Data are expressed as means ± standard error of mean (SEM). The percentages were determined by flow cytometry. ****, P<0.0001 by paired Student’s t-test or Wilcoxon test. Correlations were determined by Spearman’s rank correlation coefficients. TNFR2, tumor necrosis factor receptor type II; MPE, malignant pleural effusion; FACS, fluorescence-activated cell sorting; MFI, mean fluorescent intensity.

