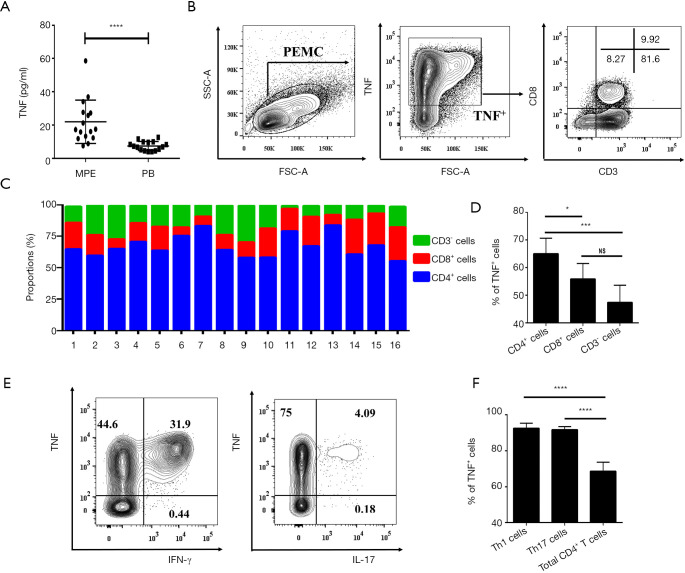
Figure 5.
The expression of TNF by Teffs in MPE. (A) Comparison of the concentration of TNF in MPE and PB from patients with lung cancer (n=16). (B) The representative identification of CD4+T cells, CD8+T cells, and CD3-T cells within TNF+ cells were determined by flow cytometry. CD4+T cells were identified based on their expression of CD3 and not of CD8. (C) Summary data of the percentages of CD4+T cells, CD8+T cells, and CD3- cells within the total TNF+ cells (n=16). (D) Comparison of the percentages of TNF+ cells in CD4+T cells, CD8+T cells, and CD3- cells in MPE (n=16). (E) The representative FACS analysis of TNF expressed by Th1 cells and Th17 cells. (F) Comparison of the percentages of TNF+ cells in Th1 cells, Th17 cells, and total CD4+T cells in MPE (n=16). Flow analysis was gated on live cells. Data are expressed as means ± SEM; *, P<0.05, ***, P<0.001, ****, P<0.0001 by paired t-test or one-way ANOVA. NS represents no statistics difference. MPE, malignant pleural effusion.

