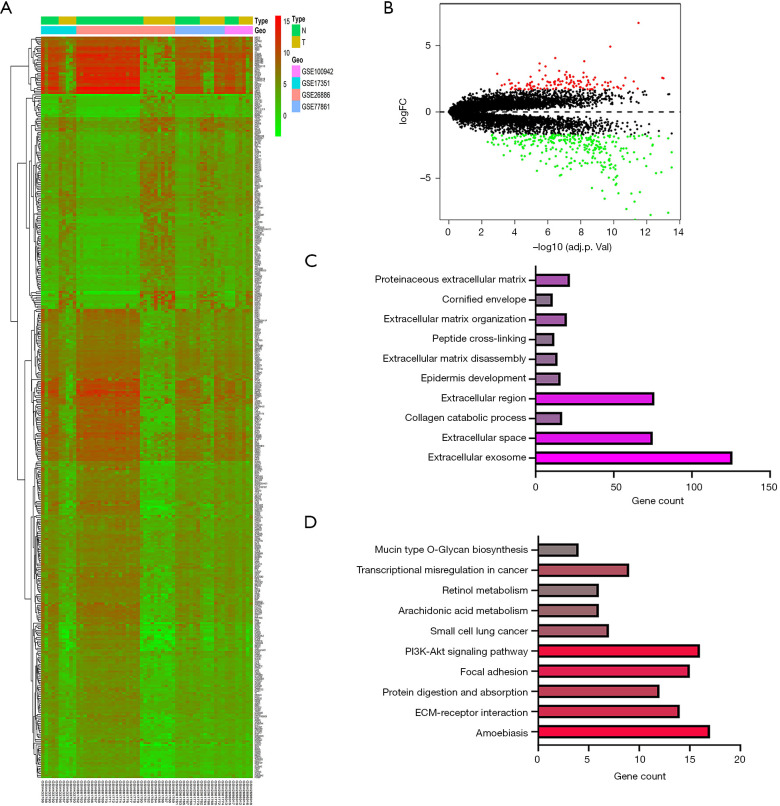
Figure 1.
Differentially expressed genes (DEGs) identified in GSE100942, GSE17351, GSE26886, and GSE77861. (A) Heatmap of the 414 DEGs according to the value of |logFC|; (B) volcano map of differently expressed genes between esophageal carcinoma (ESCA) tissues and normal esophageal tissues; (C) the top 10 Gene Ontology (GO) terms in the enrichments analysis of the DEGs; (D) the top 10 GO and Kyoto Encyclopedia of Genes and Genomes (KEGG) pathways in the enrichment analysis of the DEGs.

