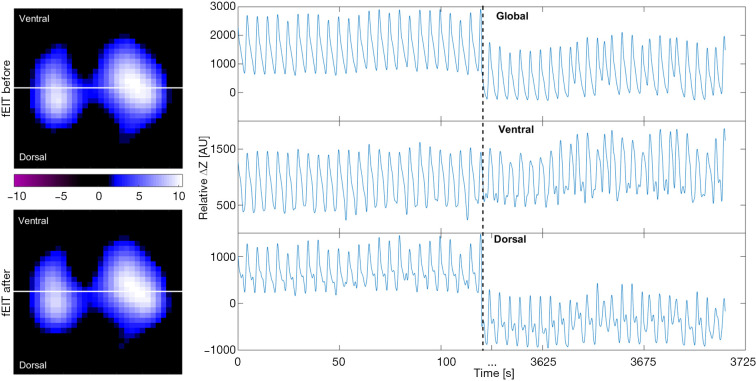
Figure 1.
Functional EIT images representing tidal variation (left) and relative impedance (ΔZ) curves (right) from one patient with acute exacerbation of chronic obstructive pulmonary disease under assist-control ventilation. The tidal variation does not change much before versus after bronchodilator administration (left top vs. left bottom image). The global impedance curve shows a decrease in end-expiratory lung impedance 60 minutes post-bronchodilation (right top image), mainly caused by the changes in the dorsal regions (right bottom image) rather than the ventral regions (right middle image). EIT, electrical impedance tomography; AU, arbitrary unit.

