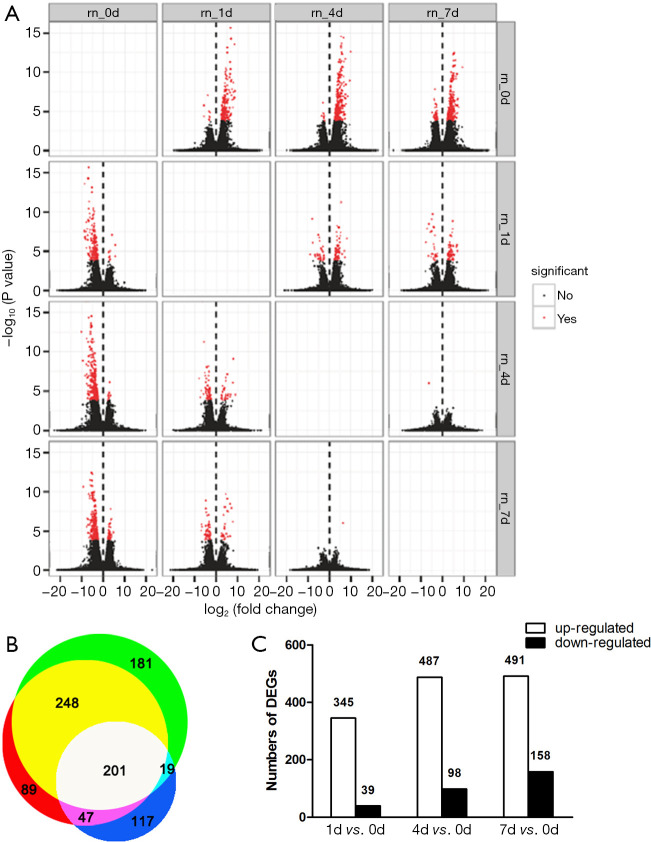
Figure 1.
Summary of differentially expressed genes at 1, 4, and 7 days post contusional spinal cord injury. An overview of transcriptome changes at multiple time points post contusional SCI. (A) Analysis of differentially expressed genes between samples by volcano mapping. The abscissa represents the fold change of transcript expression in different samples. The ordinate represents the statistical significance of the difference in transcript expression changes. Red dots indicate transcripts with significant differences. (B) Venn diagram, which shows the overlap of differentially expressed genes on day 1 (white + dark blue + purple + light blue), day 4 (white + yellow + purple + red), and day 7 (white + yellow + green + light blue) after spinal cord injury. (C) Bar graph showing the number of up- and down-regulated transcripts at 1, 4, and 7 days after spinal cord injury (FDR ≤0.001, fold change >2).

