
Figure 4.
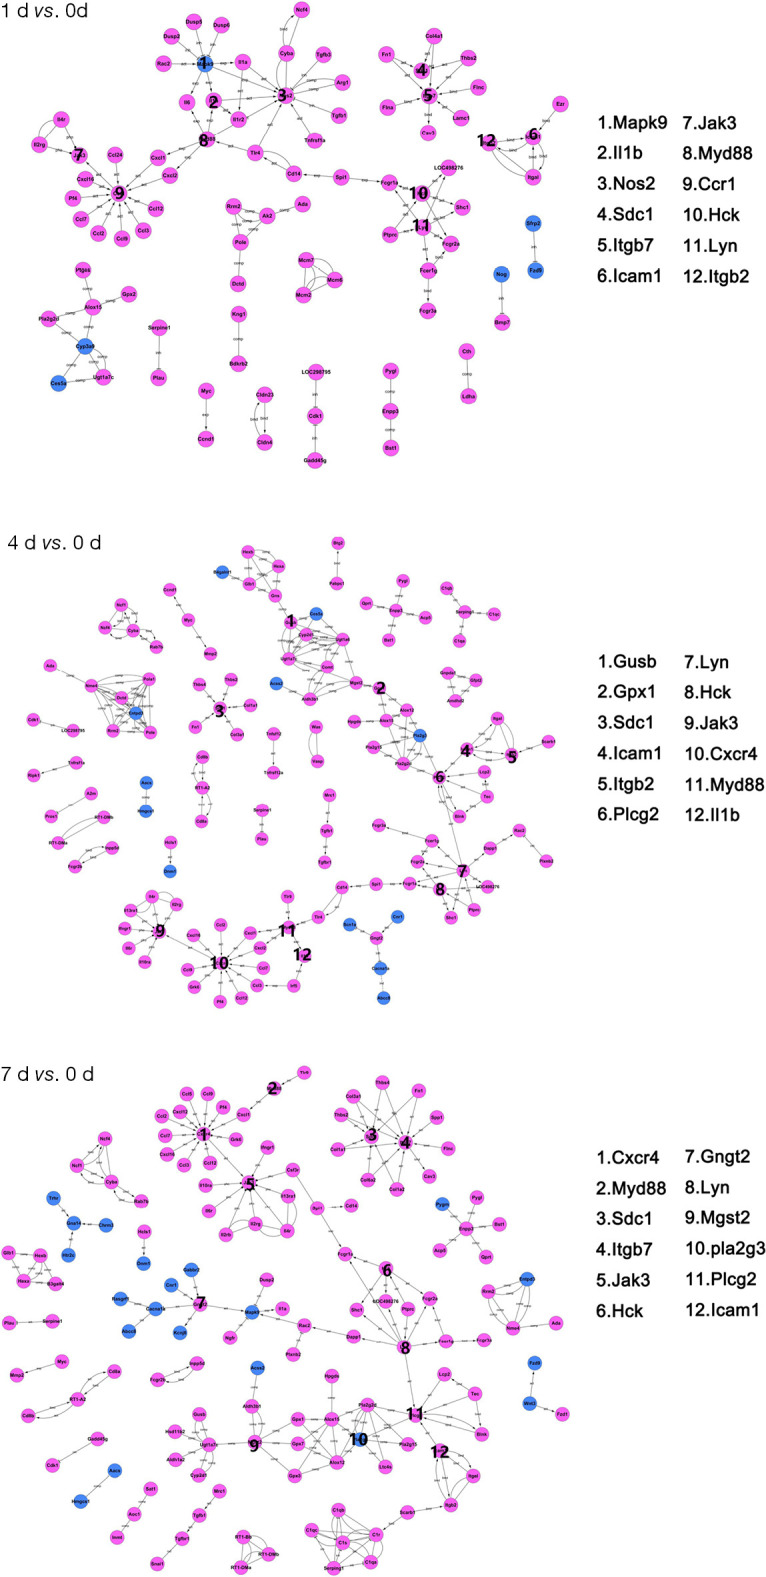
Gene act network analysis at 1, 4, and 7 days post contusional spinal cord injury. Blue nodes represent down-regulated differentially expressed genes; magenta nodes represent up-regulated differentially expressed genes. Activations and repressions are denoted by arrows and bars, respectively. The 12 genes with the most connections for each time point are listed on the right.