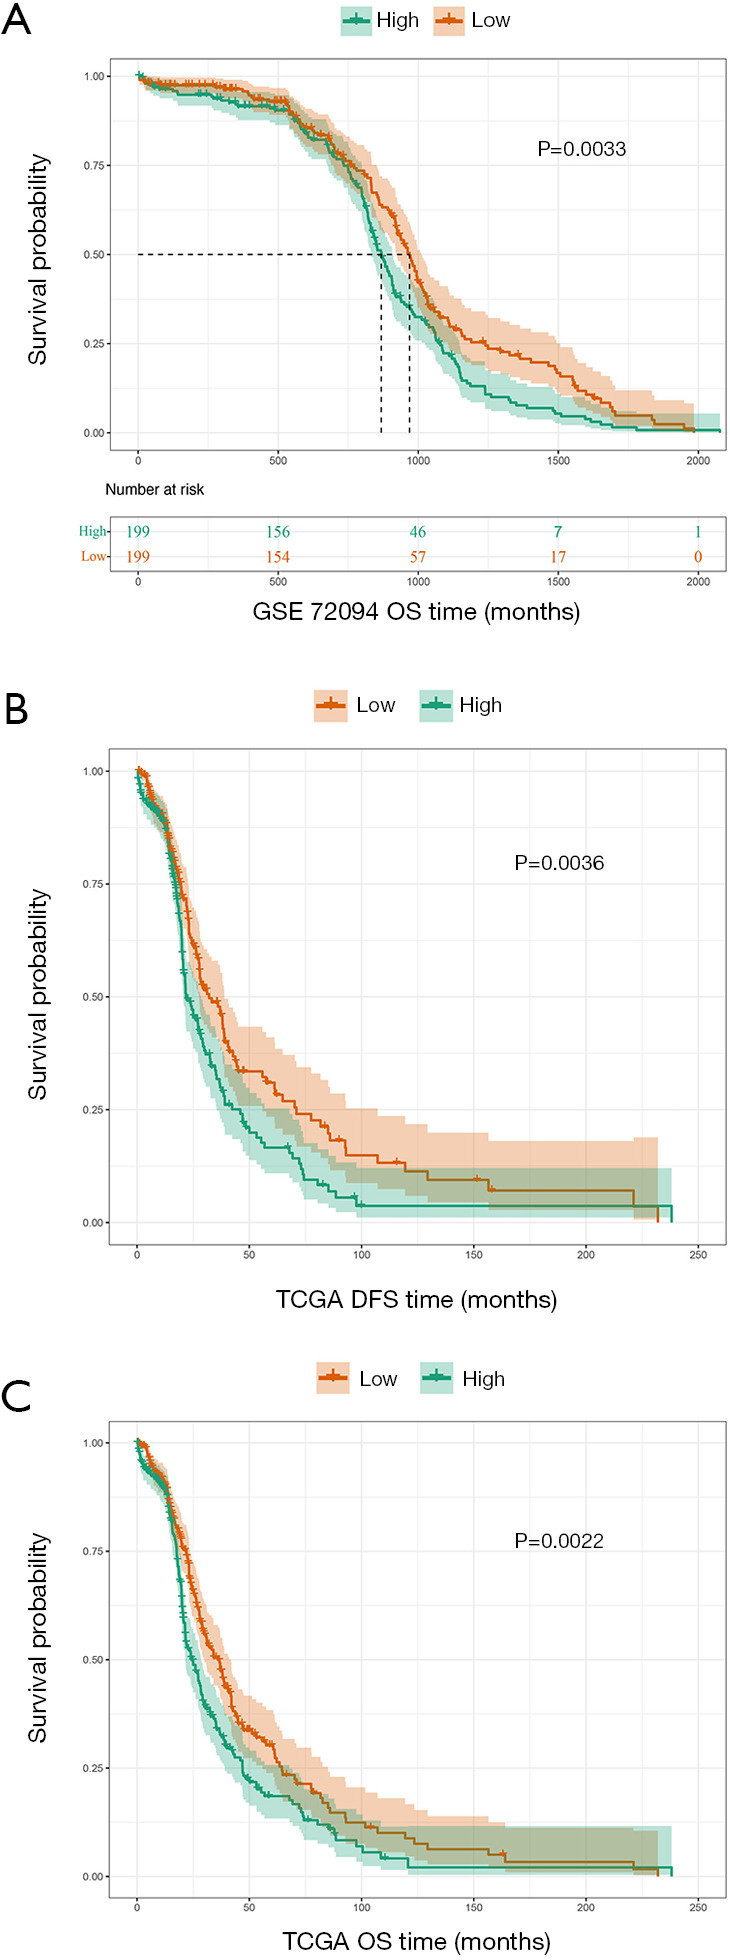
Figure 2.

Survival analysis of the queuine tRNA-ribosyltransferase 1 (QTRT1)high and QTRT1low group. The X-axis reprents the survial time (months) and the Y-axis represents survial probability. Kaplan-Meier survival curves showed that QTRT1high predicted worse survival, as per the long-rank test. (A) In the GSE72094 dataset, high expression of QTRT1 (n=199) was associated with worse overall survival (OS; P=0.0033). (B) In The Cancer Genome Atlas (TCGA), high expression of QTRT1 (n=251) was associated with worse disease-free survival (DFS; P=0.0036). (C) In TCGA, high expression of QTRT1 (n=251) was associated with worse OS (P=0.0022).
