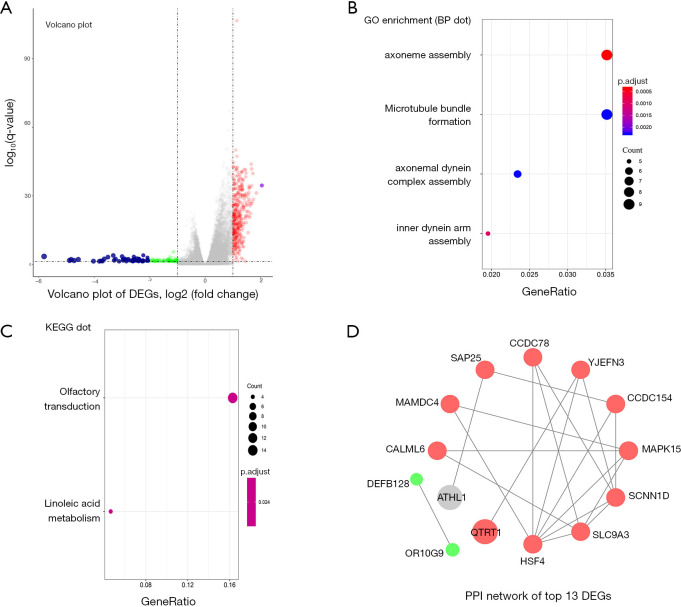
Figure 3.
Differential expression genes (DEGs) and their gene enrichment analysis and protein-protein interaction (PPI) analysis. (A) DEGs between the QTRT1high group and the QTRT1low group were shown in the Volcano plot. The criteria of cut-off for DEGs significance was P<0.05 and absolute value of log2 fold change >0.5. The X-axis displays the log2 fold change for that gene relative to QTRT1 expression, while the Y-axis displays the −log10 P value for each gene. (B) Gene Ontology (GO) results for DEGs. The X-axis represents gene ratio and the Y-axis represents different enriched biological process terms. (C) Kyoto Encyclopedia of Genes and Genomes (KEGG) results for DEGs. The X-axis represents gene ratio and the Y-axis represents different enriched pathways. (D) PPI network of top 13 DEGs: 11 up-regulated genes and 2 down-regulated genes. The red circle indicates a positive correlation, and the green circle indicates a negative correlation.

