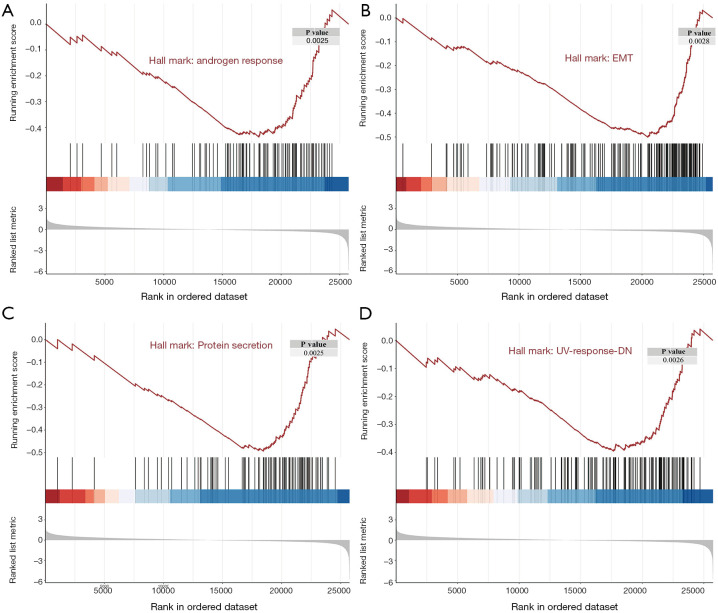
Figure 5.
Significant regulated genes by Gene Set Enrichment Analysis. (A) Gene Set Enrichment Analysis (GSEA) plot depicting the enrichment of genes down-regulated in ‘androgen response’ (P=0.0025). (B) GSEA plot depicting the enrichment of genes down-regulated in ‘epithelial mesenchymal transition (EMT)’ (P=0.0028). (C) GSEA plot depicting the enrichment of genes down-regulated in ‘protein secretion’ (P=0.0025). (D) GSEA plot depicting the enrichment of genes down-regulated in ‘UV-response-DN’ (UV-response-DN refers to genes that are down regulated by ultraviolet radiation; P=0.0026).

