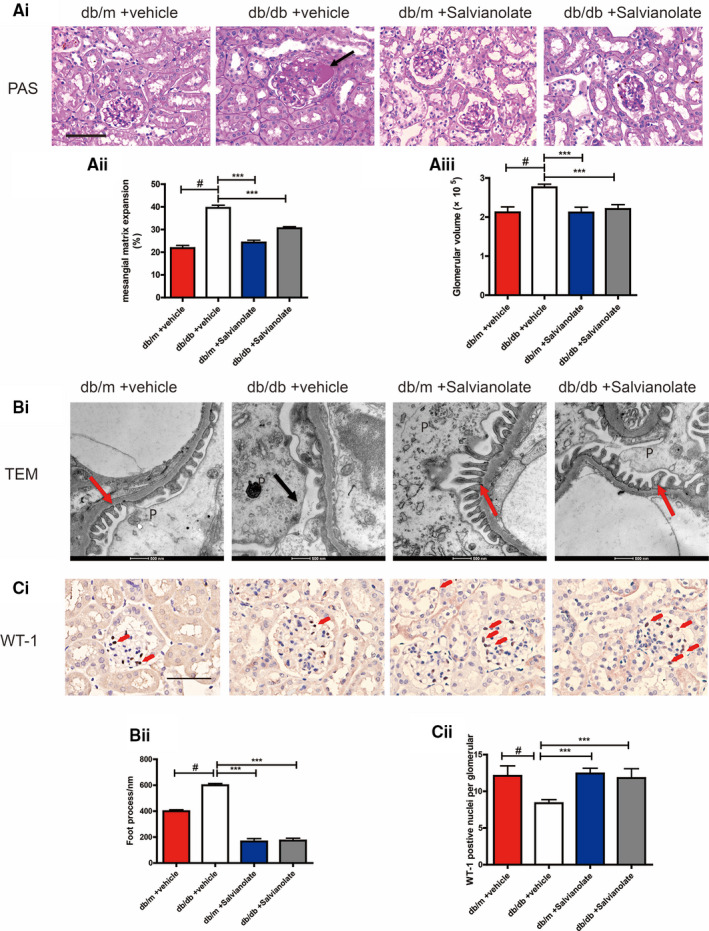
FIGURE 1.

Effects of SAL on diabetic nephropathy related histological features. A(i), representative images of periodic acid‐schiff (PAS)‐stained kidney sections (original magnification × 200, Bar = 50 μM). A(ii), quantification analysis of mesangial matrix expansion. A(iii), quantification of glomerular volume analysis of different groups. B(i), Representative TEM images of podocytes (P). black arrows indicated areas of foot process (FP) effacement. Red arrows indicated a normal foot process. B(ii), quantification analysis of foot process width. C(i), immunochemistry staining of representative kidney sections for WT‐1 in glomeruli (original magnification × 400, Bar = 100 μM, the red arrow indicates the positive nuclei). C(ii), quantification analysis of the average number of WT‐1‐positive cells per glomerular respectively. # P < .001 compared with vehicle‐treated db/m group (n = 6). ** P < .01, *** P < .001 vs vehicle‐treated db/db mice (n = 6)
