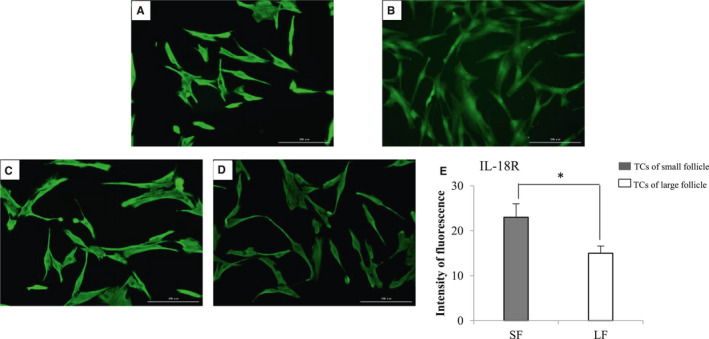
FIGURE 2.

Immunofluorescence demonstration of IL‐18R. A, Localization of IL‐18R on the surface of TCs. B, TCs without the primary antibody as negative control. C, Expression of IL‐18R in TCs of small follicles. D, Expression of IL‐18R in TCs of large follicles. Scale bars represent 200 μm. E, The fluorescence intensity of IL‐18R analysed by ImageJ (the values represent a mean value at each time point based on multiple ovaries) shows that the intensity of green fluorescence in TC cells increased in small follicles than in large follicles. Student's t test was used, and the data are expressed as mean ± SEM (n = 4). *P < .05
