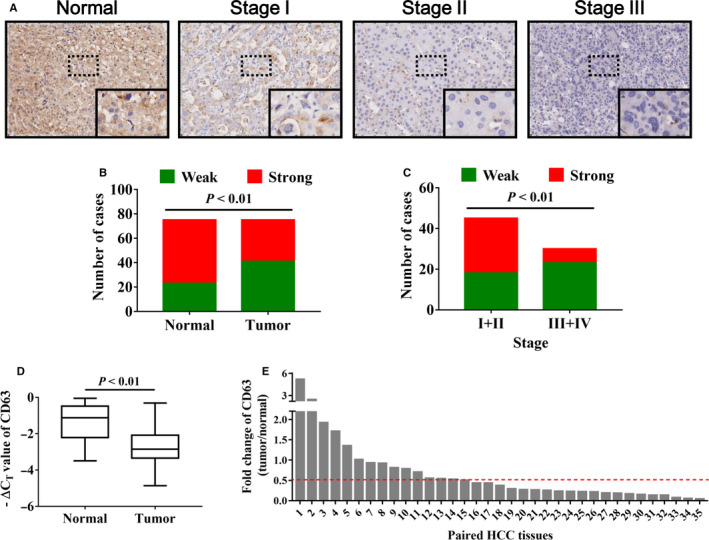
FIGURE 1.

CD63 expression is significantly decreased in HCC tissues. A, immunohistochemistry analysis was performed to detect CD63 protein expression in HCC tissues, and representative images of CD63 in different stages of HCC were shown. Magnification: 40× (upper), 200× (bottom). B, the staining results of immunohistochemistry analysis were shown in the column diagram. C, negative correlation between CD63 expression and tumour stages of HCC was shown. D, the mRNA levels of CD63 in 35 pairs of HCC tissues and adjacent normal tissues were evaluated by quantitative real‐time PCR analysis, and ‐ΔCT value represented relative expression of CD63 mRNA. E, the box plot indicated the fold changes of CD63 mRNA expression (tumour/normal) in HCC tissues
